Thursday, March 23, 2017

An early preview of 2017 40 & over 3.0 Nationals - Current top teams in the country

I've written an early preview of Nationals for the 40 & over 3.5, 4.0, and 4.5+ levels, now it is time for the 3.0 men and women.

As usual, these previews use my Estimated Dynamic NTRP Ratings and reflect the current ratings I have for the top-8 players on each roster.  What is shown is the average of those top-8.

Here are the top-30 (and ties) women's teams.

RankLocationAverage
1SOUTHERN / ALABAMA / AL - BIRMINGHAM - 20173.25
2SOUTHERN / ALABAMA / AL - BIRMINGHAM - 20173.24
3SOUTHERN / GEORGIA / GA - ATLANTA - 20173.14
4SOUTHERN / ALABAMA / AL - BIRMINGHAM - 20173.12
4SOUTHERN / GEORGIA / GA - CLARKE OCONEE - COTA - 20173.12
6FLORIDA / REGION_8 / SOUTH MIAMI/DADE3.11
7SOUTHERN / GEORGIA / GA - ATLANTA - 20173.09
8SOUTHERN / GEORGIA / GA - ATLANTA - 20173.08
8SOUTHERN / SOUTH CAROLINA / SC - GREENVILLE-UPTA3.08
10NO. CALIFORNIA / Women's 3.0 - EB3.07
11TEXAS / FORT WORTH3.06
11SO. CALIFORNIA / SO.CALIFORNIA / VENTURA COUNTY3.06
11SOUTHERN / GEORGIA / GA - NORTH EAST GEORGIA - NEGTA - 20173.06
11SOUTHWEST / CENTRAL ARIZONA3.06
15SOUTHERN / SOUTH CAROLINA / SC - HILTON HEAD-HH3.05
15HAWAII / MAUI3.05
15FLORIDA / REGION_7 / COLLIER3.05
15SO. CALIFORNIA / SO.CALIFORNIA / SAN FERNANDO VALLEY3.05
19SOUTHWEST / NORTHERN NEW MEXICO3.04
19MID ATLANTIC / MARYLAND / MONTGOMERY COUNTY3.04
19SOUTHERN / SOUTH CAROLINA / SC - LOW COUNTRY-LCTA3.04
19PACIFIC NW / NORTHWEST WASHINGTON3.04
19FLORIDA / REGION_8 / SOUTH MIAMI/DADE3.04
19SOUTHWEST / NORTHERN NEW MEXICO3.04
19SOUTHERN / GEORGIA / GA - SOUTHERN CRESCENT - 20173.04
19SOUTHERN / GEORGIA / GA - CLARKE OCONEE - COTA - 20173.04
19MISSOURI VALLEY / OKLAHOMA / OKLAHOMA CITY3.04
19SOUTHWEST / SOUTHERN ARIZONA3.04
29MID ATLANTIC / VIRGINIA / NOVA3.03
29SOUTHERN / ALABAMA / AL - HUNTSVILLE - 20173.03
29SO. CALIFORNIA / SO.CALIFORNIA / BEACH CITIES3.03
29NO. CALIFORNIA / Women's 3.0 - MA - 13.03
29MISSOURI VALLEY / IOWA3.03

It appears Birmingham is the hotbed of women's 3.0 tennis!  And Atlanta isn't far behind.  It may be tough to even make it to Sectionals.  But a bunch of other strong teams are out there, the full top-30 at 3.03 or higher.


And then the top-30 (and ties) men's teams.

RankLocationAverage
1SO. CALIFORNIA / SO.CALIFORNIA / SAN GABRIEL VALLEY3.11
2SOUTHERN / ALABAMA / AL - HUNTSVILLE - 20173.10
2MISSOURI VALLEY / OKLAHOMA / OKLAHOMA CITY3.10
4SOUTHERN / ALABAMA / AL - HUNTSVILLE - 20173.08
4SOUTHERN / SOUTH CAROLINA / SC - LEXINGTON-LATA3.08
6NO. CALIFORNIA / Men's 3.0 - DN3.07
7SO. CALIFORNIA / SO.CALIFORNIA / BEACH CITIES3.06
7SOUTHERN / GEORGIA / GA - COLUMBUS - CORTA - 20173.06
7SOUTHERN / KENTUCKY / KY - LOUISVILLE3.06
10PACIFIC NW / NORTHWEST WASHINGTON3.05
10SOUTHERN / ALABAMA / AL - BIRMINGHAM - 20173.05
10NEW ENGLAND / SOUTHERN CONNECTICUT / Southern CT3.05
10NO. CALIFORNIA / Men's 3.0 - DN3.05
14SOUTHERN / ALABAMA / AL - BIRMINGHAM - 20173.04
14SOUTHERN / GEORGIA / GA - COLUMBUS - CORTA - 20173.04
16HAWAII / OAHU3.03
16PACIFIC NW / NORTHWEST WASHINGTON3.03
16HAWAII / OAHU3.03
19NO. CALIFORNIA / Men's 3.0 - DS3.02
19NO. CALIFORNIA / Men's 3.0 - UP3.02
19SO. CALIFORNIA / SO.CALIFORNIA / SAN GABRIEL VALLEY3.02
22SOUTHERN / GEORGIA / GA - ATLANTA - 20173.01
22HAWAII / OAHU3.01
22SOUTHERN / SOUTH CAROLINA / SC - LOW COUNTRY-LCTA3.01
25PACIFIC NW / NORTHWEST WASHINGTON3.00
25NO. CALIFORNIA / Men's 3.0 - NS3.00
25TEXAS / DALLAS3.00
28SOUTHWEST / NORTHERN NEW MEXICO2.99
28PACIFIC NW / NORTHWEST WASHINGTON2.99
28SOUTHERN / SOUTH CAROLINA / SC - COLUMBIA-CTL2.99

The top-22 are all at 3.01 or higher, but there is no one team that is running away with it yet.

Contact me if you think one of the above teams is yours or you'd like to get more information or a report on yourself, your team, or your sub-flight.

Monday, March 20, 2017

An early preview of 2017 40 & over 4.5 Nationals - Current top teams in the country

I've written an early preview of Nationals for the 40 & over 3.5 and 4.0 levels, now it is time for the 4.5+ men and women.

As usual, these previews use my Estimated Dynamic NTRP Ratings and reflect the current ratings I have for the top-8 players on each roster.  What is shown is the average of those top-8.

Here are the top-30 (and ties) men's teams.

RankLocationAverage
1SOUTHERN / GEORGIA / GA - ATLANTA - 20174.64
2NO. CALIFORNIA / Men's 4.5 - LP4.63
2SO. CALIFORNIA / SO.CALIFORNIA / ORANGE COUNTY4.63
4NO. CALIFORNIA / Men's 4.5 - EB4.60
5TEXAS / AUSTIN4.57
5NO. CALIFORNIA / Men's 4.5 - MP4.57
5NO. CALIFORNIA / Men's 4.5 - SF4.57
8TEXAS / DALLAS4.56
8NO. CALIFORNIA / Men's 4.5 - MP4.56
8MID ATLANTIC / VIRGINIA / NOVA4.56
11NO. CALIFORNIA / Men's 4.5 - SA4.55
11SOUTHERN / KENTUCKY / KY - LOUISVILLE4.55
11TEXAS / DALLAS4.55
14TEXAS / FORT WORTH4.54
14PACIFIC NW / NORTHWEST WASHINGTON4.54
14TEXAS / FORT WORTH4.54
18FLORIDA / REGION_8 / BROWARD4.53
18NO. CALIFORNIA / Men's 4.5 - SF4.53
18SO. CALIFORNIA / SO.CALIFORNIA / SAN FERNANDO VALLEY4.53
18SO. CALIFORNIA / SO.CALIFORNIA / VENTURA COUNTY4.53
22TEXAS / AUSTIN4.52
22NORTHERN / NORTHERN / TWIN CITIES - 20174.52
22MIDWEST / OHIO VALLEY / COLUMBUS4.52
22TEXAS / DALLAS4.52
22NO. CALIFORNIA / Men's 4.5 - MP4.52
22SO. CALIFORNIA / SO.CALIFORNIA / INLAND EMPIRE4.52
28NO. CALIFORNIA / Men's 4.5 - MA4.51
28NO. CALIFORNIA / Men's 4.5 - SF4.51
28NORTHERN / NORTHERN / TWIN CITIES - 20174.51
28FLORIDA / REGION_2 / DUVAL4.51

Every single one of the teams has an average of 4.51 or higher.  Now, this makes a little sense as these are plus-league teams so they are likely carrying three 5.0s will pulls the averages up.


And here are the women.

RankLocationAverage
1NO. CALIFORNIA / Women's 4.5 - SF4.55
2NO. CALIFORNIA / Women's 4.5 - MA4.54
2NEW ENGLAND / SOUTHERN CONNECTICUT / Southern CT4.54
4NO. CALIFORNIA / Women's 4.5 - LP4.52
4SOUTHERN / GEORGIA / GA - ATLANTA - 20174.52
7NO. CALIFORNIA / Women's 4.5 - DN4.51
8NO. CALIFORNIA / Women's 4.5 - SA4.50
9NO. CALIFORNIA / Women's 4.5 - MP4.49
9SOUTHERN / KENTUCKY / KY - LOUISVILLE4.49
11TEXAS / DALLAS4.48
11NO. CALIFORNIA / Women's 4.5 - DN4.48
11SOUTHERN / GEORGIA / GA - ATLANTA - 20174.48
11NO. CALIFORNIA / Women's 4.5 - SA4.48
15SO. CALIFORNIA / SO.CALIFORNIA / ORANGE COUNTY4.46
15NO. CALIFORNIA / Women's 4.5 - MA4.46
17TEXAS / AUSTIN4.45
17NO. CALIFORNIA / Women's 4.5 - SA4.45
17SOUTHERN / MISSISSIPPI / MS - JACKSON4.45
20NO. CALIFORNIA / Women's 4.5 - SA4.44
20NO. CALIFORNIA / Women's 4.5 - DN4.44
22SOUTHERN / ALABAMA / AL - BIRMINGHAM - 20174.43
22NEW ENGLAND / SOUTHERN CONNECTICUT / Southern CT4.43
22PACIFIC NW / NORTHWEST WASHINGTON4.43
25SO. CALIFORNIA / SO.CALIFORNIA / ORANGE COUNTY4.42
25PACIFIC NW / NORTHWEST WASHINGTON4.42
25SO. CALIFORNIA / SO.CALIFORNIA / SAN FERNANDO VALLEY4.42
25MID ATLANTIC / MARYLAND / MONTGOMERY COUNTY4.42
29FLORIDA / REGION_6 / SOUTH PALM BEACH4.41
30SOUTHWEST / CENTRAL ARIZONA4.40
30SOUTHERN / GEORGIA / GA - ATLANTA - 20174.40
30NO. CALIFORNIA / Women's 4.5 - SA4.40
30NO. CALIFORNIA / Women's 4.5 - UP4.40
30SOUTHERN / SOUTH CAROLINA / SC - LOW COUNTRY-LCTA4.40
30SO. CALIFORNIA / SO.CALIFORNIA / BEACH CITIES4.40
30TEXAS / AUSTIN4.40

Not rated as high as the men, but still a lot of strong teams.

An early preview of 2017 40 & over 3.5 Nationals - Current top teams in the country

I just wrote an early preview of 40 & over 4.0 Nationals, now the 40 & over 3.5 level.

Here are the top-30 and ties women's teams.

RankLocationAverage
1SOUTHERN / ALABAMA / AL - BIRMINGHAM - 20173.60
2FLORIDA / REGION_8 / BROWARD3.58
3MIDWEST / CHICAGO3.57
3NEW ENGLAND / SOUTHERN CONNECTICUT / Southern CT3.57
5SOUTHERN / SOUTH CAROLINA / SC - HILTON HEAD-HH3.56
6MISSOURI VALLEY / IOWA3.55
7SOUTHWEST / CENTRAL ARIZONA3.54
7HAWAII / OAHU3.54
7NEW ENGLAND / SOUTHERN CONNECTICUT / Southern CT3.54
10SO. CALIFORNIA / SO.CALIFORNIA / SAN GABRIEL VALLEY3.53
10NO. CALIFORNIA / Women's 3.5 - FA3.53
12NO. CALIFORNIA / Women's 3.5 - LP3.52
12NEW ENGLAND / SOUTHERN CONNECTICUT / Southern CT3.52
12FLORIDA / REGION_7 / COLLIER3.52
12SOUTHWEST / NORTHERN NEW MEXICO3.52
12SOUTHWEST / CENTRAL ARIZONA3.52
18TEXAS / NOHO3.51
18SOUTHERN / MISSISSIPPI / MS - JACKSON3.51
18NO. CALIFORNIA / Women's 3.5 - SM3.51
18SOUTHERN / GEORGIA / GA - ATLANTA - 20173.51
22SOUTHERN / SOUTH CAROLINA / SC - FLORENCE-PD3.50
22SOUTHERN / ALABAMA / AL - BIRMINGHAM - 20173.50
22CARIBBEAN / PUERTO RICO3.50
22MIDWEST / CHICAGO3.50
22NO. CALIFORNIA / CV-53.50
22SOUTHERN / KENTUCKY / KY - LOUISVILLE3.50
28NO. CALIFORNIA / CV-13.49
28SOUTHERN / ALABAMA / AL - BIRMINGHAM - 20173.49
28MISSOURI VALLEY / OKLAHOMA / OKLAHOMA CITY3.49
28NO. CALIFORNIA / Women's 3.5 - SB3.49
28SOUTHWEST / CENTRAL ARIZONA3.49
28NEW ENGLAND / NORTHERN CONNECTICUT3.49

Yes, the top-18 teams are all averaging over 3.5, and the top team from Alabama averages 3.60.

Here are the top-30 men's teams.

RankLocationAverage
1HAWAII / OAHU3.60
2MID ATLANTIC / MARYLAND / MONTGOMERY COUNTY3.57
3SOUTHERN / GEORGIA / GA - ATLANTA - 20173.56
3EASTERN / METROPOLITAN REGION / Manhattan3.56
5MIDWEST / CHICAGO3.55
5SOUTHERN / ALABAMA / AL - HUNTSVILLE - 20173.55
5MID ATLANTIC / VIRGINIA / NOVA3.55
5PACIFIC NW / NORTHWEST WASHINGTON3.55
10SOUTHERN / ALABAMA / AL - BIRMINGHAM - 20173.54
11MIDWEST / WISCONSIN / MADISON3.53
11MIDWEST / CHICAGO3.53
13EASTERN / METROPOLITAN REGION / Manhattan3.52
13NO. CALIFORNIA / Men's 3.5 - MP3.52
13SO. CALIFORNIA / SAN DIEGO3.52
13NO. CALIFORNIA / Men's 3.5 - SA3.52
13MISSOURI VALLEY / IOWA3.52
18EASTERN / METROPOLITAN REGION / Manhattan3.51
18MID ATLANTIC / VIRGINIA / NOVA3.51
18SOUTHERN / ALABAMA / AL - MONTGOMERY - 20173.51
18SOUTHERN / GEORGIA / GA - ATLANTA - 20173.51
18SOUTHERN / SOUTH CAROLINA / SC - GREENVILLE-UPTA3.51
18FLORIDA / REGION_8 / BROWARD3.51
18SOUTHERN / SOUTH CAROLINA / SC - HILTON HEAD-HH3.51
25MID ATLANTIC / VIRGINIA / NOVA3.50
25SOUTHERN / GEORGIA / GA - NORTH GEORGIA - NOGTA - 20173.50
25SOUTHERN / LOUISIANA / LA - SHREVEPORT3.50
25SOUTHWEST / NORTHERN NEW MEXICO3.50
25FLORIDA / REGION_8 / BROWARD3.50
25SOUTHERN / GEORGIA / GA - CLARKE OCONEE - COTA - 20173.50

It looks basically the same as the women, the top team at 3.60, and a bunch over 3.5.

Contact me if you think one of the above teams is yours or you'd like to get more information or a report on yourself, your team, or your sub-flight.


Sunday, March 19, 2017

An early preview of 2017 40 & over 4.0 Nationals - Current top teams in the country

It is March, and we just saw the finals played in the BNP Paribas Open at Indian Wells in the California desert.  Since USTA Nationals used to be played in part in the Palm Springs area, this makes one begin thinking of Nationals.

Then, in my area our 40 & over league is just wrapping up, and other areas are also wrapping up or getting started, so it seems like a good time to take a first look at the top teams in some divisions and levels.

As usual, I'll be using my Estimated Dynamic NTRP Ratings to calculate the average dynamic rating for the top-8 players on the teams' rosters.  And I'll show the section/district/flight to let you know where the teams are from, but omit the team name to keep it a little mysterious.  Contact me if you are wanting more details on your team or what the actual teams are.

To start, we'll take a look at the 40 & over division and the 4.0 level for men and women.

First, the top-30 men's teams.

RankLocationAverage
1NO. CALIFORNIA / Men's 4.0 - SF4.04
2SOUTHERN / GEORGIA / GA - ATLANTA - 20174.02
3SOUTHERN / SOUTH CAROLINA / SC - GREENVILLE-UPTA4.01
4FLORIDA / REGION_8 / SOUTH MIAMI/DADE4.00
4NORTHERN / NORTHERN / TWIN CITIES - 20174.00
4EASTERN / METROPOLITAN REGION / Manhattan4.00
4FLORIDA / REGION_8 / SOUTH MIAMI/DADE4.00
4NEW ENGLAND / SOUTHERN CONNECTICUT / Southern CT4.00
4TEXAS / DALLAS4.00
4NO. CALIFORNIA / Men's 4.0 - DN - 24.00
4SOUTHWEST / NORTHERN NEW MEXICO4.00
4HAWAII / OAHU4.00
4NEW ENGLAND / SOUTHERN CONNECTICUT / Southern CT4.00
14SO. CALIFORNIA / SAN DIEGO3.99
14SOUTHERN / SOUTH CAROLINA / SC - LOW COUNTRY-LCTA3.99
14NO. CALIFORNIA / Men's 4.0 - DN - 13.99
14MIDWEST / CHICAGO3.99
18SO. CALIFORNIA / SO.CALIFORNIA / BEACH CITIES3.98
18NO. CALIFORNIA / Men's 4.0 - MA - 23.98
18SO. CALIFORNIA / SO.CALIFORNIA / VENTURA COUNTY3.98
18SOUTHERN / SOUTH CAROLINA / SC - HILTON HEAD-HH3.98
18EASTERN / METROPOLITAN REGION / Manhattan3.98
23NEW ENGLAND / SOUTHERN CONNECTICUT / Southern CT3.97
23SO. CALIFORNIA / SAN DIEGO3.97
23MISSOURI VALLEY / OKLAHOMA / OKLAHOMA CITY3.97
23HAWAII / OAHU3.97
23MIDWEST / OHIO VALLEY / COLUMBUS3.97
23SOUTHERN / SOUTH CAROLINA / SC - GREENVILLE-UPTA3.97
23NO. CALIFORNIA / Men's 4.0 - SA - 13.97

There are a lot of strong teams out there, and California and Southern both have a bunch of them.  Of course, this is biased towards the areas that started 40 & over early and both have teams formed and also have players that have improved.  That is really the only way you can have averages over 4.0 at this point.

Then the top-30 (and ties) women's teams.

RankLocationAverage
1EASTERN / METROPOLITAN REGION / Manhattan4.01
2SOUTHERN / GEORGIA / GA - ATLANTA - 20174.00
3NO. CALIFORNIA / Women's 4.0 - MP3.98
3NO. CALIFORNIA / Women's 4.0 - EB3.98
5NEW ENGLAND / SOUTHERN CONNECTICUT / Southern CT3.97
5SOUTHERN / ALABAMA / AL - BIRMINGHAM - 20173.97
5SO. CALIFORNIA / SO.CALIFORNIA / VENTURA COUNTY3.97
8SO. CALIFORNIA / SO.CALIFORNIA / VENTURA COUNTY3.96
9PACIFIC NW / NORTHWEST WASHINGTON3.95
9NO. CALIFORNIA / Women's 4.0 - SB - 13.95
9HAWAII / OAHU3.95
12SOUTHERN / GEORGIA / GA - ATLANTA - 20173.94
12SOUTHERN / ALABAMA / AL - BIRMINGHAM - 20173.94
12NO. CALIFORNIA / Women's 4.0 - SF3.94
12TEXAS / DALLAS3.94
19SOUTHERN / GEORGIA / GA - ATLANTA - 20173.93
19MIDWEST / CHICAGO3.93
19NO. CALIFORNIA / Women's 4.0 - UP3.93
19NO. CALIFORNIA / Women's 4.0 - EB3.93
19NO. CALIFORNIA / Women's 4.0 - MP3.93
25EASTERN / METROPOLITAN REGION / Manhattan3.92
25NEW ENGLAND / SOUTHERN CONNECTICUT / Southern CT3.92
25SOUTHERN / GEORGIA / GA - ATLANTA - 20173.92
25NEW ENGLAND / SOUTHERN CONNECTICUT / Southern CT3.92
25HAWAII / OAHU3.92
25NO. CALIFORNIA / Women's 4.0 - LP3.92
25NO. CALIFORNIA / Women's 4.0 - DS - 13.92
A similar profile of very strong teams with Southern and California dominating the list.

Again, some areas may not have started play yet, so I will revisit these lists later in the year.  And keep in mind there are a lot of teams just a few hundredths behind these teams so the specific teams can certainly change as player's ratings change.  But it looks like some sections are going to be a dog-fight to just make it to Nationals!


Sunday, March 12, 2017

What has the 40 & over division done to scheduled and matches per team? Interesting Tennis League Stats

Through 2012, USTA League had an 18 & over division and then a "Senior" division that was for those 50 & over.  In 2013, this changed to add a 40 & over division and change the existing Senior division to 55 & over.

I occasionally hear discussion about participation in the 40 & over league, if it is really needed/different from the 18 & over, and if it was just a way for the USTA to charge members to play in another league and make more money.  So looking at some stats is in order.

I've written about league participation before, but the quick summary is that in 2016 there were about 200K participants in 18 & over and 125K in 40 & over.  That likely means a lot of 40+ folks play in 18+, but 18+ is certainly still serving a large group of folks.

18 & over participation:


40 & over participation:


One can't dispute the claim that the USTA is making more money by giving those over 40 two divisions to play in.  But those players do get to play more right?

Some believe or have observed that when the split happened, the seasons for the leagues became a bit shorter, necessary in order to fit two separate seasons into the calendar.  So, I went about looking at the number of team matches played in 2012 and then successive years after the split.


In the chart above, we see that teams on average played just over 9 regular season matches per season, and since then both the 18+ and 40+ leagues have dropped to just under 9 for the 18+ and closer to 8 for 40+.

Based on this, the data does support the observation that on average, teams do have a few fewer matches.  For 18+, about one of every three teams played one match less than before the split, and 40+ has just played fewer from the start.

So it is correct that adding the 40+ league has not doubled the playing opportunity for those over 40, but it is pretty close as the matches per team has dropped only slightly.

Saturday, March 4, 2017

Poll: What should be done about allowing players to play up?

I recently wrote on the subject of competitive matches in USTA League play and how playing up affects that.  I offered some suggestions on how to address the issues while still allowing it, and some of the feedback in comments and on Facebook have added to the ideas, so I thought a poll would be in order to collect everyone's position or opinion.

See below for the poll, you can vote for multiple options as most are not mutually exclusive, but try not to vote for each of the few that are :)

I've included a little discussion on the options in the poll below it if you want to better understand what you are voting for.


What should be done about playing up in USTA League

Leave it alone, allowing playing up is needed and ok
Don't allow playing up at all, causes too many problems
Reduce the percent of roster that can be below level
Limit the number of below level players in a match line-up
Require below level players to play higher numbered courts, e.g. 3 then 2
Don't allow playing up in plus leagues
Eliminate the roster limit waiver for move-up Nationals teams
Other
Please Specify:
QuizMaker

Presently National limits the below level players at 50%, but some sections have a lower limit and apparently some a higher one. Reducing it further could be either a lower percentage or a fixed number, say three, like is done for above level players in plus leagues.

There presently is no limit on how many below level players can be in a given line-up.  If they are on the roster, they can be in the line-up.  Limiting this would probably be a fixed number like two or three.

Presently a below level player can play on any court and captains can use this to "throw" a match on court 1 while putting stronger players on 2 or 3 to try to win the team match. Limiting below level players to only play on court 3 then 2 would be similar to plus leagues where above level players must play on court 1.

You can vote for both a limit the having to play higher numbered courts to combine them and you'd have a situation where you could play two below level players, but they'd have to be both on court 3 doubles or one on court 3 doubles and one court 2 singles.  This again is like what is done for plus leagues.

The playing up problem is particularly bad in plus leagues where you can have a 5.0 playing a 4.0 on court 1. Adopting one or more other options can partially address this, but one could also just not allow playing up in plus leagues at all.

Presently, a team that goes to Nationals must split up (no more than 3 from the same roster on a team at the same level) or move-up. When they move up, the 50% roster limit is waived so they can have as many playing up as they want. This only affects a handful of teams, but perhaps it should be eliminated.

If you have another idea, write it in!

Friday, March 3, 2017

Playing up - Is it good or bad for USTA League play? Interesting Tennis League Stats

[Warning: This is a longer blog post with lots of statistics, but please do read through to the end!]

USTA League play is intended to encourage matches to be played by players of similar ability and is accomplished through the use of the NTRP rating system.  This assigns players a level based on match results, and then player join teams in leagues at their designated level.  While there are occasional exceptions and strange things that come out of the system, by and large, it works and most matches are competitive.

For example, in both the 18 & over and 40 & over leagues, a full 26% of matches go to a third set.  And if you define competitive as the losing player/pair winning at least four games, a full 80% are competitive.  If you go by a stricter definition of at least six games, the percentage drops to 60%, but still, for the most part, league matches are competitive.  And yes, at least five games is right in the middle at 70%.

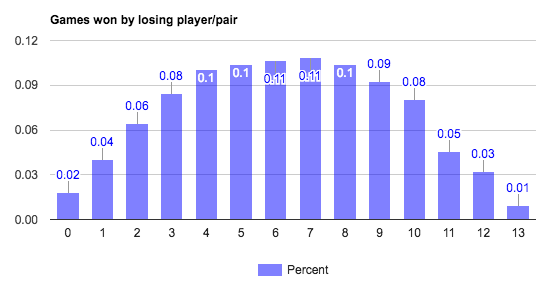
But what about the non-competitive matches, the 20% where the losing player/pair win three or fewer games?  First, there are very few double bagels, less than 2% of matches end with that score, and barely over 4% are 1 & 0 scores.  That leaves 15% where the losing pair win two or three games.

Here is a chart showing the percentage of time the losing player/pair loses each number of games.


So, what can we see from the 20% of the matches that aren't competitive?  Using my Estimated Dynamic NTRP Ratings and looking at the difference in ratings between the winning and losing player/pair in these matches, we see it averages 0.23, a pretty big gap in favor of the winning player/pair as you might expect.  Correspondingly the difference in the competitive matches averages just 0.08, the player/pair that wins is still favored, but by a lot less.

An average rating difference of 0.23 can be achieved a few ways.  That is about half the range for a level, so can easily happen when a high 3.5, say 3.4, plays a low 3.5, say a 3.17.  But being an average, that means it is likely the rating difference is quite a bit larger at times, and it becomes more difficult for two at-level players to be playing in this case.  This means that at times, the difference is due to players playing up.

Digging deeper and looking at how many times players are playing up in non-competitive matches, we see that in singles, 28% of non-competitive matches have the loser playing up against an at-level player.  Doubles is worse with 25% of matches having one lower playing up against two at-level players, and 14% of the non-competitive matches having both losers playing up against two at-level players, meaning a full 39% of non-competitive doubles matches have at least one player playing up against at-level players.

It is not a surprise that players playing up can result in non-competitive matches, but when you see the stats, it appears one could eliminate nearly 40% of the uncompetitive matches if players weren't playing up.

Which raises the question, is allowing players to play up good or bad for USTA League tennis?

On one hand, allowing playing up accomplishes a few things:
  • Teams with a small roster of at-level players can be supplemented to have a large enough roster to ensure all five courts can be fielded each match.  Or without players playing up, at-level players may not be able to field a team as they just don't have enough.
  • Players right at the threshold of being bumped up can challenge themselves against stronger players to help them try to improve their game.
  • When players right at the threshold play up and get matched up against lower rated at-level players, it can be a competitive match between players with ratings just 0.1-0.2 apart.

But on the other hand, there are some negatives:
  • Those playing up are often over-matched leading to uncompetitive matches.  This can happen especially when the playing up player is sacrificed on court 1 to try and allow their team to win courts 2 and 3.  And since anyone can play up, you could have a 2.51 "3.0" playing up against a 3.50 "3.5", a full point apart.  This goes against the purpose of the NTRP system and league tennis, to have competitive matches, and can be considered a waste of time for the at-level player to have to take the time and expense to drive to perhaps an away match and perhaps pay court fees to play a "joke" of a match.
  • Ratings can easily be skewed as the NTRP system doesn't work well or take into account some of the unavoidable by products of matches between players rated far apart.  For example, if a strong at-level player plays a weak below level player, the at-level player may be expected to not give up a game.  If they simply get lazy or purposely lose some games, or just want to be nice and not dish out the double bagel, their rating will drop and the below level player's rating will go up inappropriately.  If this happens several times, player's ratings can move enough that an unjustified bump up or down can occur.

Unfortunately for those that see the negatives as a big issue, USTA regulations don't put many limitations on playing up.  They allow up to 50% of a roster to be below level players.  And there are no restrictions on how many can be in a given line-up.  This means it is possible for an entire line-up to be below level players.

Now some sections do adopt their own rules that limit the below level players to a smaller percentage, but there are also provisions by National that all sections adopt that allow for more than 50% to be below level if the team went to Nationals the prior year and moves to a higher level flight as a team.

If one were to want to allow playing up, but try to address some of the negatives, a few things could be done:
  • Playing up could be outlawed so it isn't allowed at all.  This likely isn't going to happen.
  • The number of below level players in a line-up could be limited and perhaps be just two or three.  This would limit how often players with a large ratings discrepancy face each other.  This seams reasonable.
  • The plus leagues (40+ 4.5+ and 18+ 5.0+) have specific rules about how many above level players can be rostered (3 or 4) and play in a match (2), and also what court they must play on (1 singles or doubles), so something similar could be done for players playing up.  Limit the number to say 2, and mandate that they must play on 2 singles or 3 doubles.  This would preclude using low rated below level players as sacrificial lambs on court 1.  This also seems reasonable.
  • Introduce restrictions on who can play up, for example require that a player's year-end rating have been in at  least the upper half or even 25% of their level to preclude the lower rated below level players from playing up.  This would mean the USTA would have to disclose this information, and they tend to like to keep it all a secret, but in Georgia they have regular and "low" leagues which effectively is disclosing the same information.  So perhaps this could be done.

I'll be honest, I'm torn on the subject.  I do tend to lean towards limiting playing up and/or having some restrictions.  But I actually fall into the camp of captaining a team that needed players playing up to field a line-up and while I always played my available and healthy at-level players over below level players, I still had to run a few below level ones out every match, although it was usually just one or two and was three only once.

But I would probably support the third bullet above, adopt something similar to the plus leagues for players playing up.  That still allows it, but limits the negatives.

What do you think?  Should players be allowed to play up?  If so, should there be some restrictions of some sort?