Sunday, December 12, 2021

USTA Adult League Participation 2013 thru 2021 - Is the decline in unique players over?

Next for my year-end statistics and analysis is to look at participation numbers.  I've done this analysis in past years, so I'm continuing the same methodology this year which is to look at unique players that played in the main Adult leagues, i.e. 18 & Over, 40 & Over, 55 & Over, and 65 & Over.

This is clearly an odd year to be looking at participation with the USTA treating 2020/2021 as one rating period or "year", and 2020 being abbreviated due to COVID, and 2021 still affected as some players still stayed away to limit interaction with outsiders.

So should 2020/2021 be treated as one year?  Or should each year be looked at individually?  In general, I'm going to treat it as one year in this post, but I'll split out the years a little bit to see what we can learn.

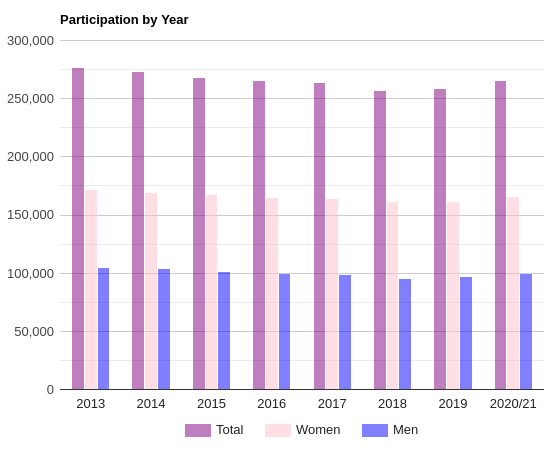
First, here is participation across all the divisions and treating 2020/2021 as one period.

Using this approach, participation in 2020/2021 is up over 2019!  In fact, it is back to 2016 levels!  Does this mean the steady decline in participation is over and there may be some growth?

I'm not sure that is a reasonable conclusion as combining any other two years would show significantly higher participation in that combined period, so combining 2020/2021 and see a slight bump should not be construed as real growth.

To illustrate that, here is what the chart looks like if each year is independent.

This more clearly shows what really happened, COVID wreaked havoc with participation in 2020, it is almost surprising it wasn't lower, and then 2021 has clearly recovered but is still well short of where things were in 2019.

It is obviously not fair to judge 2020 or 2021 as separate years against 2019, but combining them can be misleading too as it masks what is likely still a decline in participation.  I think I've shown the effect of COVID with the chart above though, so for the rest of this post I'll look at the different divisions using a combined 2020/2021.

Next, we look at unique players in 18 & Over.


This shows a slight decline from 195K to 193K, even with the combined 2020/2021.  So the same concern I've noted in past years remains, it appears either younger folks aren't joining USTA and playing league, or as existing players age they are choosing not to play 18 & Over.

Next, 40 & Over.


And here is where we see growth that makes up for the decline in 18 & Over.  The player population is aging and more are becoming eligible for 40 & Over it appears, and they do take that opportunity to play it.

Last, 55 & Over.

Interestingly there is a decline here even with the combined years.  Either there are just fewer players due to age, or those 55+ were more leery of coming back due to COVID concerns.

What do you think?  What does this tell us?  Anything?  Or due to COVID too many variables to make any conclusions?

Note: These are statistics from the data I've gathered and may not exactly match the USTA's data or they may report numbers using different criteria than I am.
Saturday, December 11, 2021

An early look at 2021 USTA NTRP year-end rating appeals - women appeal up and down, men appeal down

2021 year-end ratings have been published for 11 days now, and I've done some analysis already, but I thought I'd take a look at how many players have successfully appealed.

Note of course, there very well may be more players that appeal and have it granted in the future.  As hard as it may be to believe, not everyone lives and dies by their year-end rating and some players may not think about appealing until they start signing up for leagues in the new year.

But a lot of players do try their appeals right away, so at this point, I think we can get a good idea of the general trends.

First, at a high level, for players that received a 2021 year-end C rating, there have been 3,546 successful appeals 2,186, or 62% of them down and 1,360, or 38% up.  So more appeals down than up, but not quite a 2 to 1 ratio.

Next, breaking it out by gender, the women account for 2,166, or 61% of the appeals and 47% were down and 53% were up.  This is quite balanced and pretty close to 50/50.

For the men, they were just 39% of the appeals and a whopping 84% were down and just 16% up.  Clearly the men are biased towards appealing down.

But the level matters too, as it is more understandable that lower rated players may have a desire to appeal up while higher level players want to appeal down, sometimes just to have more playing opportunity.

For the women, here is how it breaks out for each year-end C rating and how many appealed either way:

  • 2.5 - 337 up
  • 3.0 - 66 down, 476 up
  • 3.5 - 206 down, 294 up
  • 4.0 - 342 down, 35 up
  • 4.5 - 281 down
  • 5.0 - 118 down
  • 5.5 - 11 down

We do see that as the year-end level goes up it swaps from players appealing up to appealing down.

For the men, here is how it breaks out:

  • 2.5 - 16 up
  • 3.0 - 12 down, 85 up
  • 3.5 - 197 down, 80 up
  • 4.0 - 433 down, 34 up
  • 4.5 - 377 down, 3 up
  • 5.0 - 138 down
  • 5.5 - 5 down

We see more appeals up at 3.0, but unlike the women the swap to more down happens at 3.5.  And the men have far fewer appealing at all at 2.5 and 3.0.

It appears men are more likely to appeal down than women are, but this is in large part because men tend to have more players appeal at the middle/higher levels than the women, and it is more likely that higher level players are going to appeal down than up.

What do you think?

Friday, December 3, 2021

Analyzing 2021 USTA NTRP year-end ratings - Bump rates by level and gender

With 2021 year-end ratings published, following on the bump rates by section, next up in the analysis is bump rates by level.

For all these charts, remember what is reported is percentages of players bumped up or down from the listed level, not raw numbers.  So there were not more total 5.5s bumped down than any other bump, rather the percentage of 5.5s bumped down was higher than any other percentage.

Here is the overall chart.


Probably not a big surprise, a lot of 2.5s bumped up, and more 3.0s and 3.5s bumped up than down, but at 4.0 and above, more players are bumped down than up.

Looking at just the women.


Similar trend, the scale of the chart is different because there are fewer 5.5s bumped down for the women.

And the men.


Again, very similar.

It will get more interesting to look at this by section which will come soon.

Wednesday, December 1, 2021

Are there irregularities with 2021 year-end Mixed ratings? Let me know if you've seen some

2021 USTA League year-end ratings are out, and I'm doing my analysis and writing down various observations, and it is too early for me to make any conclusions about what is going on with Mixed (M) year-end ratings, but something seems off.  I will continue to do my research and report back when I determine anything, but if you've seen something strange, players that should have gotten an M rating and didn't, or players that got a C rating that should have gotten an M, please drop me a note and let me know.

Analyzing 2021 USTA NTRP year-end ratings - Section bump rates by gender

2021 year-end ratings have been published, and my analysis continues.

I looked at some high level bump stats earlier, now we start to take a deeper dive, first looking at bump rates by section by gender.

Here are the overall bump stats by section.

Here we see remarkably consistent bump rates across all the sections.  Bump down rates range from 4.4% in PNW to 7.6% in Southern and bump up range from 8.6% in NorCal to 11.3% in Caribbean.  This is not nearly as large a range as in most years (here is 2019) and would seem to indicate the USTA didn't do much of any adjusting.

In fact, the sections that did well at Nationals weren't even hit that hard with bump ups which is surprising.  How on earth does Southern, that cleaned up at Nationals across genders and divisions, have among the fewest bump ups and most bump downs?  While PNW that did very little at Nationals has among the most bump ups and fewest bump downs?

Moving on to look at each gender.  Here is the same chart for the women.

Here we see Caribbean and Missouri Valley with the most bump ups, Hawaii and Northern having the fewest, and Southwest and Intermountain the most bump downs and several sections with less than 5% bump downs.

And here is the men's chart.

In what seems way out of whack, Southern and Texas had more men bumped down than up!  And Northern on the other hand led in bump up percentage which may be a first.

The Southern anomaly may be in part a reaction and adjustment to the Great Southern Bump of 2019, but that still is very strange considering how Southern did at Nationals.

While there are not radical changes, there do seem to be a few oddities for sure.  What do you think?


Tuesday, November 30, 2021

Analyzing 2021 USTA NTRP year-end ratings - An initial look at some high level stats

2021 year-end ratings are out, so now we can begin looking at some stats.

First, by my calculations over 251K players received a year-end rating, which is up slightly from 2019 when 245K did.  This is probably a good thing as any growth is good, but keep in mind 2021 included two years of play (albeit pandemic affected in 2020) so we aren't exactly comparing apples to apples.

Breaking this out by gender, women with year-end ratings rose from 150K in 2019 to 153K in 2021, and the men went from 94K to 98K.

Looking at bump rates, overall 6.5% of players were bumped down while 9.7% were bumped up.  This compares to 2019's 4.9% down and 10.5% up.

Breaking this out by gender, women had bump down/up rates of 6.1% and 10.6% which compares with 2019's 5.3% and 9.2%.  The men had 7.3% down and 7.9% up compared to 2019's 4.0% down and 12.9% up.

Stay tuned for more stats in the coming days.

2021 year-end NTRP ratings have been published!

It has been much anticipated, and has finally happened, the USTA has published year-end ratings for 2021!  As I write this, there are at least some players with 2021 year-end ratings on TennisLink.

When the USTA did not publish ratings for 2020 year-end, it created a backlog of players that were probably at the wrong level, and after waiting an extra year we now get to see how the ratings have played out and how players have been bumped up or down.

To check what your rating is, you can go to TennisLink and look yourself up, or login and it should show your rating.  Make sure to check the date and that it is 12/31/2021 as that is what all new ratings should show.  If it still says a different date, yours may not be updated yet, or you didn't play enough matches to get a new rating.

Stay tuned for analysis of the ratings, but if anyone has any questions or wants to get a report to understand why they were/weren't bumped up or down, contact me!  And I'm always interested in situations where players successfully appeal, so if you do that and it is granted, drop me a note.

I'll be doing my usual analysis in the next few days, looking at general bump rates, then drilling in by gender and level and section (those links to 2019's analysis) to see what we can tell about how the USTA handled things this time around.  So stay tuned!

Monday, November 29, 2021

2021 Southern Combo Sectionals are this weekend - Get a simulation report!

While USTA League Nationals are over, and ratings are due out in days, USTA League playoffs continue, and in the Southern section is holding it's Combo League Sectionals this weekend.

More and more sections are adopting the unflighted round-robin format and it appears it is being used for Combo Sectionals, which makes it fun for me as that is when my simulation reports are useful and give an idea how balanced the schedules are and who is most likely to advance to the semis.

I've already done one simulation report for one of the levels at the event, if you are interested in getting one yourself, let me know!

Thursday, November 18, 2021

2021 year-end NTRP ratings are being calculated, when will they be published?

2021 USTA League Nationals are over, and that means 2021 year-end NTRP ratings are now being calculated.  I've confirmed the cut-off date for matches this year was November 14th so everything should be in and calculations can commence.

I don't know the specifics of the process the USTA goes through at year-end, but believe that National does the calculations, taking the final dynamic rating for all players and then doing their year-end calculations to factor in what happened at Nationals and filter that back down through the sections.  I understand sections/districts may be given preliminary ratings to review, presumably to look for gross errors or things that seem out of whack so those can be researched and a determination made on if/how to correct or adjust things.

So when will it all be done and ratings published?  The date that seems to be out there this year is December 1st and this would be consistent with past years where the ratings generally come out the week after Thanksgiving and 12/1 would be the Wednesday after Thanksgiving this year.  Could they come out a little earlier or later than that date?  Sure, but my guess is the ratings will begin to show up late the night before, or right around 12:00 AM ET on 12/1.

It will be interesting to see what happens this time around, I've already written a bit about what might happen and why, and I'll likely write some more using my ratings as a predictor of what could happen.  But this is an odd year with a 2-year rating period and more matches played than normal, so it might not exactly fit the profile of prior years.

If you can't wait the two weeks for ratings to come out, or are just interested in seeing a detailed breakdown of how you did in 2020/2021, I continue to do my Estimated Dynamic NTRP Rating Reports that uses the ratings I calculate that give what has historically been a pretty accurate correlation with what the USTA publishes.  If you are interested, contact me at ratings@teravation.net.

Wednesday, November 17, 2021

What might the results from 2021 USTA League Nationals mean for year-end bumps? And why did some sections do so well?

I took a look at how each section did at Nationals, both at a high level and by division, and several sections did very well, Southern, SoCal, and Florida topped the list, while others struggled to make the semis more than a couple of times.  One logical question is why it can be so lopsided, and another is what it might mean for year-end ratings?

On the first question, I think there are several contributing factors.

One is that some sections just have more densely populated areas, so more players to pull from, so it isn't necessarily that a top 4.0 in section A is better than a top 4.0 in section B, rather section A just has more top 4.0s to form teams from and so they are a deeper team.

Another is that the road to Nationals for some sections is more grueling than others, and the team that survives and advances is more battle tested and prepared for Nationals and able to pull out the close matches.  Southern teams for example generally have to go through local playoffs, State playoffs where it is multiple flights leading to semis and a final, and then Sectionals where it is against multiple flights leading to semis and a final.  Many other sections may only have two rounds of playoffs, and a given round may involve just round-robin, or two small flights and a final.  Less matches in pressure situations may not prepare a team for Nationals as well.

It is also possible that despite the USTA's best intentions, their year-end benchmarking doesn't perfectly level the playing field across the sections.  For example, at 2019 year-end, Southern had a large number of players bumped up, but then in something of a reversal, suddenly a lot of players were able to appeal down.  It may be that the mass bump up was justified and would have leveled the playing field, but allowing the appeals tilted things in Southern's direction again.

But another big factor this year is that this is a 2-year rating period and there were no bumps in 2020.  This means there are players that had two years to improve and be clearly out of level now, but still be eligible to play at their 2019 year-end level at Nationals.  While this could happen in any section, it is more likely to happen in sections where more tennis could be played year-round, for example where COVID restrictions didn't close indoor courts for periods, and guess what, Southern, SoCal, and Florida certainly fit this definition.

What do you think?  Why did some sections do significantly better than others this year?

On to the next question of what all this means for 2021 year-end ratings.

I already wrote about Intermountain's success in the 18 & Over division, particularly for the women, and that that might mean more bump ups in the section than normal.  For the same reason, Southern, SoCal, and Florida very well could expect to see more bump ups than normal.

We know the USTA, whether with an override or as part of the normal year-end calculations, tends to have higher bump rates for sections that do well at Nationals, and in some years some sections are hit hard in what appears to be attempt to level the playing field.

What is unknown is if the USTA will feel compelled to make any adjustments this year with the 2-year rating period, or exactly how the 2-year rating period will affect things, or if things will just change organically.

My League Coordinator has already notified captains in our league starting in January that are now forming teams that they may expect more players to be bumped up than normal due to the 2-year rating period.  If that is true as a baseline, and sections that did well at Nationals get an even higher rate, we may see some "interesting" bump rates in two weeks when ratings are published.

What have you heard, or what do you think will happen?

Tuesday, November 16, 2021

A finer grained look at 2021 USTA League Nationals results by section - Who did the best in each division?

I wrote earlier today a high level summary of how the different sections did at Nationals, and it certainly wasn't balanced.  Southern, SoCal, and Florida, along with Midwest and Intermountain, had significantly better results than the other sections.

In the earlier post, I broke it down as far as men/women/mixed, but now I'll go further and break it down by different divisions.  A few other sections did well, but overall the big-5 still appear the most.

For 18 & Over, here is the full breakdown.

The women were led by Intermountain making the semis in 5 of 6 events and making the final twice.  No championship, but their 11 points bettered New England who only made the semis twice, but too the championship each time.  Southern did well with 7 points just ahead of Midwest, Mid-Atlantic, and Florida.

For the men, Southern led making 4 of 5 semis and garnering 9 points which just beat out the Intermountain men making 2 semis and coming away with two titles.  Missouri Valley led a group just behind along with Mid-Atlantic, Midwest, PNW, and Southwest.

For 40 & Over, here is the full breakdown.

The women were led by Florida and Southern Cal with 2 semis and 6 points apiece across the 4 events.  Midwest, Northern Cal, and PNW also had good showings.

The men saw Midwest and Texas garner 7 points across 2 semis each, Middle States and Eastern did well too.

For 55 & Over, here is the full breakdown.

The women saw Florida not only make 4 semis, but made all the finals and took 3 titles home!  Southern Cal had a very respectable 8 points making 3 semis but was well back.

But the Southern Cal men made all the finals and took 2 titles home to better Southern who made 4 semis and got one title.

Last, here is the full breakdown for Mixed.

In 18 & Over, Southern Cal stood out making 4 of the 5 semis and garnering 10 points, well ahead of Intermountain and Northern Cal.  Midwest and Southern were close behind those two.

The 40 & Over had Mid-Atlantic make 3 of the 4 semis, but Florida made 2 semis and won both titles to lead in points.  Texas also did well making 2 finals and winning 1.

What do you think?  What does this say about all the sections?

2021 USTA League Nationals Summary - Southern, SoCal, and Florida Dominate

2021 USTA League Nationals ended this past Sunday with 40 & Over Mixed, which means we can look at a summary of all of the events.

For this summary I'm looking at the number of times each section made the semis, and then points accumulation where 4 points are awarded for 1st, 3 for 2nd, 2 for 3rd, and 1 for 4th.

The overall leader for semis appearances is Southern making the semis in an astonishing 20 of 36 events.  Not far behind is Southern California with 16 semis appearances, and Intermountain, Midwest, Florida, and Mid-Atlantic were all in doubles digits with 12 or 13.

But if we go by points accumulation, the overall leader is SoCal and Southern, both with 45 points.  While SoCal didn't make the semis as often, when they did, they did well.  Florida and Midwest were not far behind at 40 and 37, then Intermountain is next at 30 and Texas makes an appearance at 24.

Broken down by gender though, Florida is the clear leader for the women with 8 semis and 26 points, with SoCal (6/15), Midwest (5/14), Intermountain (6/13), and Southern (6/12) next in line.

For the men, Southern leads with 10 semis and 24 points, with Midwest (6/17), SoCal (5/16), and Intermountain (4/10) also in double digit points.

Last, in Mixed, SoCal leads with 5 semis and 14 points, with Florida (3/11), Southern (4/9), and Texas (3/9) next in line.

No section went home completely blanked, Caribbean and Hawaii brought up the rear but both made the semis twice and garnered 4 points.

Here is the full table, the leader in each category (row) is in green.

More to come.

Update: See a finer grained breakdown of the events by division by section.

Monday, November 15, 2021

The USTA recaps USTA League Nationals with "up close and personal" stories across the sections

The 2021 USTA League Nationals finished yesterday with the 40 & Over Mixed events being contested, and this morning in my inbox was an e-mail from the USTA recapping the six weeks with a number of stories across the sections.  The stories, at least those I read, are not and detailed review of an event but instead a look at the background or softer side stories about the teams that advanced.

The stories seem to be authored by the sections and some were more prolific than others.  Here is a count by section.

  • Midwest - 5
  • Mid-Atlantic - 5
  • MoValley - 5
  • Southern - 4
  • Eastern - 4
  • New England - 2
  • National - 1
  • Middle States - 1

Come on USTA, there are more than seven sections!  Where are the stories from the other 10?  Did they all choose not to participate?

The stories are a nice touch though, give them a read.

Results from the sixth and last weekend of 2021 USTA League Nationals - How did the predictions do?

The sixth weekend of 2021 USTA League Nationals is complete, and it is time for the summary and check on how the predictions did.

This weekend was only 40 & Over Mixed with the 6.0 and 9.0 levels being played in Orlando and the 7.0 and 8.0 levels in Surprise.

The 6.0 level had Texas, PNW, Southern, and Mid-Atlantic make the semis, the first three at 4-0 with Mid-Atlantic being the pick of a 4-way tie at 3-1.  The simulation had three of these in its top-7, but PNW was the surprise.  The semis has Texas and Southern winning with Texas taking the title.

At 7.0, SoCal, Southwest, MoValley, and Middle States made the semis, the first two at 3-0 and the next two in a 4-way tie at 3-1.  This was unexpected as just SoCal was in the simulation's top-4.  But the simulation was right in SoCal being the strongest of those that made it as they faced off against Southwest in the final and won it 3-0.

The 8.0 level saw New England, Florida, Mid-Atlantic, and Eastern advance, the first two at 4-0 and another 4-way tie at 3-1.  These teams were all in the top-9 of the simulation and three expected to be in it at 3-1.  Eastern and Florida won their semis with Florida taking the title.

Last, at 9.0, Florida, Texas, Middle States, and Mid-Atlantic made the semis, two at 4-0 and the other two in a 3-way tie at 3-1.  Three of these teams were in my simulation's top-5.  Florida and Texas won the semis and Florida took the title.

Congratulations to the champs!

So that's a wrap for Nationals.  The next big "event" is year-end ratings should be published right around two weeks from now on/around December 1st.  Stay tuned for more on that!

Thursday, November 11, 2021

The last 2021 USTA League Nationals are this weekend - 40 & Over Mixed all at once

We've made it through Adult Nationals including 18 & Over, 40 & Over, and 55 & Over, and 18 & Over Mixed Nationals wrapped up their two weekends of events last week, and now we come to the last weekend of Nationals as 40 & Over Mixed plays all four of their levels in one weekend.

The levels are split across two locations, the 7.0 and 8.0 being played in Surprize, AZ (the 7th straight weekend of hosting Nationals!) while the 6.0 and 9.0 will be in Orlando (only the 4th straight weekend).

For those saying "what about 65 & Over and Tri-Level, don't they count?", you would be correct they have not been played yet, but technically those are "Invitationals" and not normal Nationals.

The Tri-Level event is scheduled for March 4-6 in Rancho Mirage, CA making for a fun trip to the California desert during the Indian Wells event, while the 65 & Over event will be held over three weekends in late January and early February in Surprise, AZ.

Good luck to all those playing this weekend!

Saturday, November 6, 2021

Is Intermountain going to bear the brunt of the USTA's 2021 bump ups?

At year-end when the USTA does their year-end ratings and players are bumped up or down, not all sections are treated equally.  Some sections get far more bump ups than others, see the analysis I did at the end of 2019 and 2018 where you can see the bump rates can vary significantly by section.

One might wonder, what is this based on?  Why would the USTA bump up a lot more players in one section than another?

The answer is the year-end calculations the USTA does try to level the playing field across all of the sections, so that a 3.5 in Southern California is relatively the same as a 3.5 in New England, or a 4.0 in Southern is relatively the same as a 4.0 in Northern.

A key factor in the year-end calculations is how each section does at Nationals.  If one section does really well at Nationals, that is probably an indication that their players are stronger than players in other sections and to level things, more bump ups may be in order.  In the past Southern, PNW, Caribbean, and Texas have all been sections to get abnormally high bump up rates, and this generally correlates with how the section did at Nationals.

So who is in line to get the big bump up rates in a month when year-end ratings come out?

Intermountain appears to be a key candidate.  Here is how they did at 18 & Over Nationals:

  • 18 & Over 2.5 women - semis
  • 18 & Over 3.0 women - finals
  • 18 & Over 3.0 men - champs
  • 18 & Over 3.5 women - finals
  • 18 & Over 3.5 men - 8th
  • 18 & Over 4.0 women - 14th
  • 18 & Over 4.0 men - champs
  • 18 & Over 4.5 women - semis
  • 18 & Over 4.5 men - 7th
  • 18 & Over 5.0 women - semis
  • 18 & Over 5.0 men - 8th

In a full 7 out of 11 events Intermountain made at least the semis, made the final 4 times, and won twice.

In 40 & Over, it wasn't as clearly dominant, but in the 8 events there were 2 that made the semis and two others finished 5th.

Who knows what will happen with the USTA dealing with a 2-year rating period, but my guess is Intermountain may get and justify a higher than normal number of bump ups, certainly at several levels.

What do you think?

Friday, November 5, 2021

A review of 40 & Over 4 court format - And PNW abandons points per position for 40 & Over for 2022

In my area (Seattle) our 40 & Over league gets started right away in January and as such the League Coordinator has been sending out reminders about getting teams signed up and whatnot.  In a message today, it was noted that for 2022, our 40 & Over league will no longer use points per position scoring but instead revert back to teams wins, and associated tie-breakers, for determining standings.

As a reminder, my section (PNW) went to this format when the 40 & Over league switched to the 4-court format which brought 2-2 ties into play, as points per position and standings based on accumulated points allows weighting courts so a 2-2 tie on the court isn't a 2-2 tie in points, and it also removes the team win from being a factor in the standings.  This was necessary as at the time the 4-court format was introduced, the National regulations did not say what would happen if there were a 2-2 tie that was tied on all the published tie-breakers.  And it was occurring before National clarified the rules.

While some sections have used, and will continue to use, points per position for leagues regardless of the number of course, apparently those in my area responded to a survey saying they were not in favor of it and PNW listened and is changing back.  I personally didn't mind points per position, I just considered it "different", but I expect folks will be more comfortable with the traditional way of doing standings.

But that begs the question of how 2-2 ties will now work?

The answer is it will work using the tie-breaker that National put in place after 2020 40 & Over leagues started when they discovered they hadn't accounted for everything, and that is that if the teams are still tied after the sets lost and games lost tie-breakers are applied, the winner of the team match will be the team that won court 1 doubles.

In the message received today, it was noted that the court 1 doubles winner would be the last tie-breaker, and also made the statement that it was rare for a match to get to the point of the court 1 winner deciding the team match winner.  Well, if you have read my blog for long, you know something like that causes me to go look to see if the statement in fact is true.

I have researched this a bit before, in fact I looked at how often ties happened at 40 & Over Nationals a few weeks ago, but that was before all of 40 & Over was done, so taking a look again, there were 292 team matches played, 84 of them (29%) were 2-2 ties, 31 of these (11%) were also tied on sets, and finally 3 were tied on games as well and as a result were decided by the team that won court 1 doubles.

Now, three is not a lot, but that is out of 292 matches and three represents just over 1% of all matches.  One percent probably does qualify as "rare", but clearly it does happen so one should not construe the claim of rare to mean it will probably never happen.

And before you say it is so "rare" that it would never happen in a meaningful match, one of the three occurrences was in the semi-final match for the 4.5 men, and another was in a match that decided who advanced to the semis for the 3.5 women.  Matches don't get much more important than these.

But what about across all 40 & Over play?  For 2021, there were 27,751 team matches played for 40 & Over using the 1 singles 3 doubles format, of these 7,204 (26%) ended in 2-2 ties, 2,927 (11%) were tied on sets, and 248 (1%) were tied on games.  The percentages are remarkably close to those at Nationals.

So, with this rule in place, it appears one can expect 1% of matches to be decided by the court 1 winner.

I know many people, myself included, don't like the 4-court format, but given it is still here, do you prefer court 1 doubles deciding ties?  Did you like points per position to just make 2-2 ties inconsequential?  Or prefer another way to handle it?

Wednesday, November 3, 2021

What the USTA could learn from the ITF - How to break ties in round-robin play!

The ITF Billie Jean King Cup, the event that used to be Fed Cup, is taking place this week in Prague.  It is a competition between countries

In the past, Fed Cup was played over three weekends throughout the year with four pairs of teams facing off one weekend early in the year with one of the countries being the host, the the winners advance to the semis two pairs play with one country being the host, and the winners then play the final near the end of the year with one of the countries being the host.  The format for each tie was two singles matches on day 1, then reverse singles on day 2 followed by a double match to potentially determine the winner if the singles matches split 2-2.

In its new form, there are 12 countries that compete, and the whole competition is played over the course of one week all in one location.  Instead of having an elimination bracket, the 12 teams are split into four groups of three countries each where each country plays two round-robin ties against the other two teams in their group.  Each tie is two singles and one doubles match.  The winners of each group advance to the semis where an elimination draw is then played.

For those that follow USTA League, this format probably sounds familiar, as Nationals uses round-robin play to determine four teams to advance to the semis to play an elimination draw.  One of the issues I've identified in the past is how the USTA determines the standings if there are ties on wins/losses, so naturally I wanted to see how the ITF did this for a group based format to see if similar issues existed.

With round-robin formats, it is possible, and often happens, for teams to tie on win/loss record.  When this happens, the event determines how to break the tie using other finer-grained criteria than wins and losses.  In the case of the USTA, they use:

  • Individual match/court record
  • Head to head
  • Sets lost
  • Games lost

What the ITF uses is:

  • Head-to-head
  • Percent of matches won
  • Percent of sets won
  • Percent of games won

The criteria look similar, but there are some key differences.

First, the ITF places head-to-head ahead of the other criteria.  One can debate which approach is the best, but there are some that think the USTA should do the same.

Second, individual match/court record and percent of matches won is effectively the same, so the next difference is sets lost vs percent of sets won.  These may sound similar but are in fact different, and the ITF gets this right while using sets lost is one of the flaws in the USTA's tie-breakers.  Using just sets lost ignore actually winning sets, while percent of sets won includes the won and lost sets and is more comprehensive and equitable.

Third, if teams do happen to still be tied, the USTA uses games lost while the ITF again gets it right and uses percent of games won.  Using just games lost is a huge flaw in the USTA's approach as this criteria rewards losing a set 6-0 (six games lost) over losing a set 7-6 (seven games lost) which is clearly inequitable, but the USTA has stuck with their criteria despite feedback and a regulation change proposal to fix it.

Before you say, it isn't a big deal, the tie-breakers never go this far or the scenario is unlikely, this flawed tie-breaker has reared its ugly head numerous times including a few weeks ago at 2021 Nationals.  Even if it had never happened, it is silly to have a bad rule and pass it off as unlikely, but it has happened, so USTA, pay attention to the ITF and get this one right!

Monday, November 1, 2021

The remainder of 2021 USTA League Nationals are Mixed


We are into November, and as is often the case, that means the only remaining USTA League Nationals are for Mixed doubles leagues.

This weekend finishes up the 18 & Over Mixed with the 7.0 and 9.0 levels playing in Surprise, AZ.

Next weekend 40 & Over starts and finishes with the 7.0 and 8.0 levels in Surprise, and the 6.0 and 9.0 levels in Orlando.

Good luck everyone!

Sunday, October 31, 2021

Results from the fifth weekend of 2021 USTA League Nationals - How did the predictions do?

The fifth weekend of 2021 USTA League Nationals is complete, and it is time for the summary and check on how the predictions did.

The 55 & Over 6.0 and 9.0 were played in Orlando and at the 6.0 level for the women, SoCalSouthwestFlorida, and Mid-Atlantic made the semis.  Three of those teams were in my projected top-5 and all four were in my top-7.  SoCal and Florida both won 2-1 to make it to the final with SoCal winning 2-1, and they were the top pick to win it all in the simulation.

The 6.0 men had Southern, Midwest, Middle States, and SoCal make the semis, two in my top-4 and all four in my top-8.  SoCal and Midwest both won their semis 2-1 and Midwest took the final. 

At 9.0, the women's flight saw Southern, Florida, Eastern, and Mid-Atlantic make the semis, all four in my simulation's top-5.  Southern and Florida made the final where Florida won 2-1 to take the title.

The 9.0 men had Southern, SoCal, Middle States, and Intermountain advance to the semis, all four in my simulation's top-6.  Southern and SoCal won their semis and then SoCal won the final.

18 & Over Mixed got going in Arizona with the 6.0, 8.0, and 10.0 levels playing.

The 6.0 level had Intermountain, SoCal, Texas, and Southern make the semis, all four of those in my top-7.  Intermountain and SoCal, the two in my top-7, won their semis with Intermountain taking the title.

The 8.0 level had SoCal, Intermountain, Hawaii, and NorCal advance to the semis, all in my top-4!  NorCal and Hawaii won their semis and NorCal took the title.

The 10.0 level saw New England, SoCal, NorCal, and Eastern make the semis, all four in my top-5.  Eastern and NorCal won their semis with Eastern taking the title.

Congratulations to this weekend's champs.

Friday, October 29, 2021

A loss for PNW USTA is a gain for USTA National

If you are a regular reader of my blog, you know I live in the Seattle area and thus play in the Pacific Northwest section of the USTA.  Playing in the PNW, I've had the opportunity to interact with local and section USTA staff including Adam Hutchinson who over the years has grown to be responsible for effectively all competition, Adults and Juniors, in the PNW.  I worked on a regulations change proposal with Adam and he has been a great resource for other questions and, in my opinion and despite occasionally not agreeing on everything, has done a great job with league play in my section.

I learned yesterday that, unfortunately, Adam is leaving the PNW section, but fortunately, he is staying with the USTA and moving to National to be responsible for adult competition including league and tournament play.

Adam has been an advocate for growing the game, and PNW is one of the few sections to have had USTA League participation grow recently, team count was up 8% from 2014 to 2019 and player count up 5%, despite the general trend the other direction across all of USTA League play, player count down almost 10% over the same period.  So while I'm sorry to see him leave PNW, I'm encouraged that National is getting someone with a proven record of running leagues and tournaments in an area that has shown growth.

Good luck Adam and don't forget PNW way off in the other corner of the country!

Thursday, October 28, 2021

Another big weekend of 2021 USTA League Nationals starts tomorrow

The 2021 edition of USTA League Nationals has been ongoing this month and we enter the fifth weekend with a pretty big schedule.  While it is only at two venues, there are multiple levels being played at each so a lot of tennis will be played and five champions will be crowned.

The 55 & Over Nationals continue in Orlando with the last of the division's levels, 6.0 and 9.0, being played.  While in Surprise the 18 & Over Mixed begins with each of the 6.0, 8.0, and 10.0 levels being contested.

Good luck to all playing this weekend!

Sunday, October 24, 2021

Results from the fourth weekend of 2021 USTA League Nationals - How did the predictions do?

 The fourth weekend of 2021 USTA League Nationals is complete, and it is time for the summary and check on how the predictions did.

The 55 & Over 8.0 was played in Orlando and for the women, FloridaMoValleyMiddle States, and SoCal made the semis.  Three of those teams were in my projected top-7.  Florida and Middle States played in the final with Florida winning 3-0, and they were the second pick to win it all in the simulation.

The men had SouthernHawaiiSoCal, and Mid-Atlantic making the semis.  The winners of the semis were SoCal and Southern, with SoCal winning the final 2-1, and SoCal was the predicted winner of my simulation.

The 40 & Over 3.0 was played in Surprise, AZ and for the women, FloridaPNWMidwest, and Eastern made the semis, all undefeated, all four of these in my projected top-5.  The other team in my top-5, Intermountain, finished 5th so the predictions had all of the top-5.  The semis had Eastern and PNW winning, with PNW winning it all.

The men had PNWEasternMid-Atlantic, and Florida in the semis, all undefeated, two of these being in the projected top-4, two being a surprise.  Florida and Eastern won their semis and Eastern won it all.

Congratulations to this weekend's champs.

Wednesday, October 20, 2021

Simulating 2021 USTA League Nationals - 40 & Over 3.0 Men

As I did in 2018 and 2019, I will be doing simulations of each Nationals to predict who the most likely four teams are to make the semi-finals, and also look at other interesting things that may occur.  In the two years I've done this, the simulations have done a pretty good job predicting who would advance to the semis including having all four teams predicted correctly several times.

Why do these simulations you ask?  The primary reason is that the format for USTA League Nationals is now a flight-less random round-robin where each team plays four other random opponents.  This introduces significant variations in schedule strength, the possibility of an undefeated team not making the top-4, and teams vying for the top-4 perhaps not having played head-to-head and unfortunate tie-breakers being used.  The simulations aim to educate folks on how it all works and look at what may happen.  Also see this write-up for some things to know about Nationals.

We now enter the fourth weekend of Nationals, and the 40 & Over 3.0 level is being played in Surprise, AZ.  Here is what is likely to happen for the 3.0 men.

As a reminder, my simulations are done using my Estimated Dynamic NTRP Ratings and looking at the average rating for the top group of players on each team, the actual schedule each team will play, and then doing a million simulations of the matches with some random variation in each team's expected result.

Teams: 15
5+ undefeated: 0%
4 undefeated: <1%
Tie for 4th: 82%
Size of tie: 4 - 30%, 5 - 24%, 3 - 21%, in theory could be 12!
Sets tie-breaker: 26%, 2 teams 67%, 3 teams 27%
Easiest schedule: 3.03
Toughest schedule: 3.10
Likely semi-finalists: IntermountainMid-AtlanticSouthernEastern
Contenders: Middle States, Southwest, Texas, Midwest

There are likely a few 4-0 teams and 3-1 should be required to make the semis.

For those interested, I offer a variety of reports to make Nationals more fun and help captains prepare.  I have a Simulation Report that has all of the details of the simulation including the average ratings for each team, each team's schedule strength, the most likely record for each team, and the chance of each possible record for each team.  I also offer reports to help teams scout opponents in more detail, both a Flight Report with full roster averages, top-8 averages and played by court averages for each team, as well as full Team Reports with detailed ratings for each rostered player and stats who who plays with who and on which court and how they do together.  Contact me if interested in any of these reports.

Monday, October 18, 2021

2021 USTA League Nationals continues this weekend

The 2021 edition of USTA League Nationals just wrapped up week three which  means week four is on the horizon.  It isn't going to be nearly as busy, but week three was the busiest with four events going on simultaneously.

This coming weekend finds the last 40 & Over event being played in Surprise, AZ while the 55 & Over continues in Orlando with the 8.0 level being played there.

Stay tuned for some predictions from my simulations and other info as the week progresses.

Sunday, October 17, 2021

How is the 4-court format working for 2021 40 & Over Nationals? How are the ties being handled?

The USTA changed the 40 & Over division to a four court format for 2020, but with no Nationals last year, this year's Nationals was the first chance for it to be used.  The big issue is with four courts, there is a clear possibility, if not significant probability, that matches will end in 2-2 ties.  If that happens, who wins?

I wrote about how it all works a couple weeks ago, but now with most of the 40 & Over events complete, we can take a look at how things have played out.

So far, there have been 202 team matches played at 40 & Over Nationals, and of these, 64 have ended tied 2-2 on courts.  Of these, 38 had a winner declared based on who lost the fewest sets.  That leaves 26 matches going to the next tie-breaker, loser of the fewest games where 24 were decided.  That leaves two matched tied on all the criteria, which means the winner is the team that won court 1 doubles.

Note, there were eight other matches that were within a game or two of being full ties and having to go to the court 1 doubles winner tie-breaker.

First, regular readers of my blog know I've been critical of the tie-breakers the USTA uses for standings at Nationals where sets and games lost are used.  Let me say that in the case of a head-to-head match, the tie-breakers are not "flawed" and are in fact objective and not omitting information that should be used.

Note however that when the USTA first made the change to four courts, they did not have a provision to determine a winner if tied on games lost, and had to add using the winner of court 1 doubles after the fact and after a number of league matches ended in complete ties.

That said, in my opinion, it isn't terribly satisfying to have a match determined not by who wins the most courts, but instead by inspecting finer grained statistics.  One of the beauties of tennis and its scoring system is that winning a match doesn't require winning the most games or points, and winning a match in a super tie-break is a win just like a lopsided straight-sets win is.  But when there are an even number of courts and 2-2 ties can happen, it forces the use of these tie-breakers fundamentally changing the strategy of a team match.  A captain now has to worry about not just winning courts, but instead how the courts are won as there is a chance that will be used to determine the winner.

Now, change isn't necessarily bad.  One might argue that this format and use of tie-breakers discourages sacrificing a weaker player/pair against a strong pair, since a lopsided loss could hurt in the tie-breakers, and that is a good thing.  In a way, this gives the advantage to the deeper team and reduces the changes the "little guy" can pull an upset.  If you want the "better" team to win more of the time, this change is probably a good thing.

I still contend it was a mistake to go to a four court format, for this "2-2 tie" reason but others as well, but after a couple of years of it being used and one Nationals being nearly complete, what do you think?

Results from the third weekend of 2021 USTA League Nationals - How did the predictions do?

The third weekend of 2021 USTA League Nationals is complete, and it is time for the summary and check on how the predictions did.

The 55 & Over 7.0 was played in Orlando and for the women, Florida, Texas, Midwest, and SoCal made the semis.  Three of those teams were in my projected top-7.  Florida and Midwest played in the final with Florida winning 2-1.

The men had Caribbean, Midwest, Southern, and SoCal making the semis, two of those in my projected top-4 and all of them in the top-8.  The winners of the semis were SoCal and Southern, with Southern winning the final 2-1.

The 40 & Over 3.5 was played in Oklahoma City and for the women, Florida, NorCal, SoCal, and Intermountain made the semis, three of those in my projection's top-4, and my top-7 including all four teams.  Intermountain had to perhaps unfairly play Florida in a semi and lost 2-2 on the sets lost tie-breaker, with SoCal winning the other semi and Florida winning it all.

The men had Middle States, NorCal, Midwest, and Texas in the semis, three of those overachieving from a projected 2-2 record, and again the flawed tie-breaks perhaps got the seeing wrong.  Texas and Midwest won their semis and Midwest won it all.

The 40 & Over 4.5 was played in Arizona and for the women, Southern, NorCal, Northern, and SoCal all went 4-0 to make the semis, all in the top-7 of my projection.  The semis were won by SoCal and NorCal with NorCal winning the California battle.

The men had Texas, SoCal, MoValley, and Southern make the semis, Southern getting the spot on the games lost tie-breaker, three of these teams in the projection's top-7.  Texas and MoValley won the semis, both 2-2 scores, with MoValley "winning" because they won court 1 doubles.  In the final, Texas won to take the title.

The 18 & Over 4.0 was played in Arizona as well, and for the women, Florida, New England, Southern, and Middle States made the semis, Middle States winning the sets lost tie-breaker over Texas.  All four of these teams were in my projection's top-8.  Middle States and New England won their semis, New England taking it all.

The men had Intermountain, Southern, Northern, and Midwest making the semis.  Midwest got the last spot winning the sets lost tie-breaker over Southwest.  Just two of these teams were in my projection's top-7.  Intermountain and Southern won their semis, and Intermountain took the title.

Congratulations to this weekend's champs.

Saturday, October 16, 2021

The broken USTA League Nationals standings tie-breaker rules rear their ugly head again

USTA League Nationals continued this weekend and I was just browsing results and unfortunately came across another case of the broken tie-breakers used for standings at Nationals getting the standings what I consider to be wrong.  It has happened before, and has now happened again.

At the 40 & Over 3.5 women's event, there was a 4-way tie at 3-1 for 3rd thru 6th.  Two of the teams, SoCal and Intermountain, were tied on court record at 10-6.  This means the flawed tie-breakers come into play.

Specifically, the next tie-breaker is sets lost, and both teams lost 16 sets.  The fact that Intermountain won 21 sets as compared to SoCal's 20 sets is ignored, it is not included in the tie-breakers.  The next tie-breaker is games lost and SoCal lost 144 to Intermountain's 146, so SoCal gets 3rd.

In addition to Intermountain winning an extra set, what the USTA's tie-breakers also ignore is that Intermountain won 156 games compared to SoCal's 142.  In fact, SoCal lost more games than they won, 142-144, while Intermountain won significantly more than they lost, 156-146.

By ignoring sets won, what the USTA is basically saying is that if you lose an individual court, there is no difference between losing in straight-sets vs losing in a 3rd set tie-break.  In this case, Intermountain lost as many sets as SoCal, but took more matches to third set tie-breaks, but gets no credit for doing so.

And the games lost tie-breaker is just fundamentally broken, as it says it is better to lose a set 6-0 (6 games lost) than 7-6 (7 games lost).  This is simply baffling.  And indeed, in their first match Intermountain lost a set 7-6, and in their third match lost a set 7-5.  Had they lost those sets 6-2, clearly not as good a result, they would have tied on games lost and the tie-breaker would have gone to game winning percentage where Intermountain would have won.  How does this make sense?

Now, you might argue, this was just determining 3rd vs 4th, both teams are advancing.  That is true, but that doesn't give the flawed tie-breakers a pass.  And it is actually meaningful as it affects seeding and Intermountain must face a Florida team that had a 14-2 court record while SoCal gets to face NorCal that only had an 11-5 court record.  So the flawed tie-breakers do have a significant impact on Intermountain's ability to make the final.

I've written about this before, I even submitted a regulations change proposal to fix it, but the USTA elected to not act on it.  I guess they simply don't care about equitably determining standings at Nationals.

What do you think?  Should Intermountain have been third in the standings instead of SoCal?  Should the USTA change the standings tie-breakers?

Quick update on week three of 2021 USTA League Nationals

It is Saturday morning which means one day is in the books for the third week of 2021 USTA League Nationals.

The 40 & Over 3.5 women has five teams at 2-0 with another seven at 1-1, and my simulation now says just two will finish 4-0 with a 4-way tie for two spots at 3-1.  Eastern, Caribbean, SoCal, and Intermountain will be trying to join Florida and NorCal in the finals.

The 40 & Over 3.5 men has six teams at 2-0, but just one with a most likely record of 4-0 now.  This leaves a 5-way tie for three spots, could be a tight tie-breaker with teams tied a 9-7 on courts with Middle States, Eastern, NorCal, Texas, and Florida in it to join Midwest.

The 18 & Over 4.0 women has five 2-0 teams and the simulation likes three to get to 3-0 (Florida, Texas, Middle States) with New England, Southern, Mid-Atlantic, and NorCal vying for the last spot.

The 18 & Over 4.0 men also has five 2-0 teams, and here the most likely records are 3-1 for five teams, but I can't imagine at least one doesn't get to 4-0 as two have over a 40% chance of it.  But look for Intermountain, Northern, Texas, Midwest, and Southern to be in it, and a tight tie-breaker deciding it.

The 40 & Over 4.5 women has a whopping six teams at 2-0 and three are expected to get to 4-0, Southern, SoCal, and Florida, with a 3-way tie at 3-1 for the last spot with NorCal, Northern, and New England in it.

The 40 & Over 4.5 men also has six teams at 2-0 and here again three are expected to be 4-0, SoCal, Mid-Atlantic, and Texas, with a 4-way tie for the last spot with Northern, Southern, MoValley, and PNW vying for the spot.

The 55 & Over 7.0 women has five teams at 2-0 and two are expected to remain undefeated in Hawaii and Southern, then a 4-way tie for two spots with Texas, PNW, Florida, and Eastern in it.

The 55 & Over 7.0 men also have five teams at 2-0 and SoCal and Caribbean are expected to get to 4-0, and then Middle States, Texas, and Midwest will try to get the last two spots.

Good luck everyone!

Friday, October 15, 2021

Simulating 2021 USTA League Nationals - 55 & Over 7.0 Me

As I did in 2018 and 2019, I will be doing simulations of each Nationals to predict who the most likely four teams are to make the semi-finals, and also look at other interesting things that may occur.  In the two years I've done this, the simulations have done a pretty good job predicting who would advance to the semis including having all four teams predicted correctly several times.

Why do these simulations you ask?  The primary reason is that the format for USTA League Nationals is now a flight-less random round-robin where each team plays four other random opponents.  This introduces significant variations in schedule strength, the possibility of an undefeated team not making the top-4, and teams vying for the top-4 perhaps not having played head-to-head and unfortunate tie-breakers being used.  The simulations aim to educate folks on how it all works and look at what may happen.  Also see this write-up for some things to know about Nationals.

We now enter the third weekend of Nationals, and the 55 & Over 7.0 level is being played in Orlando.  Here is what is likely to happen for the 7.0 women.

As a reminder, my simulations are done using my Estimated Dynamic NTRP Ratings and looking at the average rating for the top group of players on each team, the actual schedule each team will play, and then doing a million simulations of the matches with some random variation in each team's expected result.

Teams: 16
5+ undefeated: <1%
4 undefeated: 5%
Tie for 4th: 81%
Size of tie: 3 - 32%, 4 - 25%, 2 - 22%, in theory could be 11
Sets tie-breaker: 30%, 2 teams 65%, 3 teams 28%
Easiest schedule: 3.54
Toughest schedule: 3.65
Likely semi-finalists: SoCalTexasNorthernCaribbean
Contenders: Middle States, MoValley, Southern

The simulation says just a 3-way tie at 3-1 for two spots, but six at 2-2 looking to get into the fray.

For those interested, I offer a variety of reports to make Nationals more fun and help captains prepare.  I have a Simulation Report that has all of the details of the simulation including the average ratings for each team, each team's schedule strength, the most likely record for each team, and the chance of each possible record for each team.  I also offer reports to help teams scout opponents in more detail, both a Flight Report with full roster averages, top-8 averages and played by court averages for each team, as well as full Team Reports with detailed ratings for each rostered player and stats who who plays with who and on which court and how they do together.  Contact me if interested in any of these reports.

Thursday, October 14, 2021

Simulating 2021 USTA League Nationals - 18 & Over 4.0 Women

As I did in 2018 and 2019, I will be doing simulations of each Nationals to predict who the most likely four teams are to make the semi-finals, and also look at other interesting things that may occur.  In the two years I've done this, the simulations have done a pretty good job predicting who would advance to the semis including having all four teams predicted correctly several times.

Why do these simulations you ask?  The primary reason is that the format for USTA League Nationals is now a flight-less random round-robin where each team plays four other random opponents.  This introduces significant variations in schedule strength, the possibility of an undefeated team not making the top-4, and teams vying for the top-4 perhaps not having played head-to-head and unfortunate tie-breakers being used.  The simulations aim to educate folks on how it all works and look at what may happen.  Also see this write-up for some things to know about Nationals.

We now enter the third weekend of Nationals, and the 18 & Over 4.0 level is being played in Surprise, AZ.  Here is what is likely to happen for the 4.0 women.

As a reminder, my simulations are done using my Estimated Dynamic NTRP Ratings and looking at the average rating for the top group of players on each team, the actual schedule each team will play, and then doing a million simulations of the matches with some random variation in each team's expected result.

Teams: 16
5+ undefeated: <1%
4 undefeated: 6%
Tie for 4th: 88%
Size of tie: 4 - 28%, 5 - 23%, 3 - 23%, in theory could be 11
Sets tie-breaker: 27%, 2 teams 66%, 3 teams 28%
Easiest schedule: 3.88
Toughest schedule: 3.97
Likely semi-finalists: NorthernTexasFloridaMiddle States
Contenders: Mid-Atlantic, NorCal, Southern, New England

The simulation says a big 6-way tie at 3-1 are the most likely records, but five teams have a better than 25% chance of getting to 4-0 so that very well could happen for a team or two, but a tie at 3-1 for the last spot is still very likely.

For those interested, I offer a variety of reports to make Nationals more fun and help captains prepare.  I have a Simulation Report that has all of the details of the simulation including the average ratings for each team, each team's schedule strength, the most likely record for each team, and the chance of each possible record for each team.  I also offer reports to help teams scout opponents in more detail, both a Flight Report with full roster averages, top-8 averages and played by court averages for each team, as well as full Team Reports with detailed ratings for each rostered player and stats who who plays with who and on which court and how they do together.  Contact me if interested in any of these reports.