Thursday, December 8, 2022

Analyzing 2022 USTA NTRP year-end ratings - How often do appeals stick? How many are inappropriate?

I just wrote about 2022 year-end ratings and how many players have already appealed their rating, but a natural follow up question is how many of these appeals are really appropriate?

Allowing appeals is seemingly done for a few reasons:

  • Players get bumped up but want to continue to play their their old team and friends
  • Players get bumped up and there is no flight at the higher level and appealing down allows them to play
  • Players are improving but just missed a bump up and want the validation of the higher rating by their name
  • A team at the higher level needs players but roster limits require a minimum number of at-level players so if someone appeals up, they help meet that minimum number

One can debate which of the above, or other reasons there might be, are legitimate reasons to appeal, but one could also make the case that if someone appeals and then goes back to their old rating after a year, perhaps that appeal wasn't appropriate or justified.

Whether you agree with the characterization of this scenario indicating an inappropriate or unjustified appeal, it is a statistic we can look at so I went above doing so.  What I'll be doing is looking at players that appealed in year X but in year X+1 went back to their old level.

I will note that my data is not necessarily 100% perfect, but I think it is good enough for us to get a good idea of what happens with players that appeal.

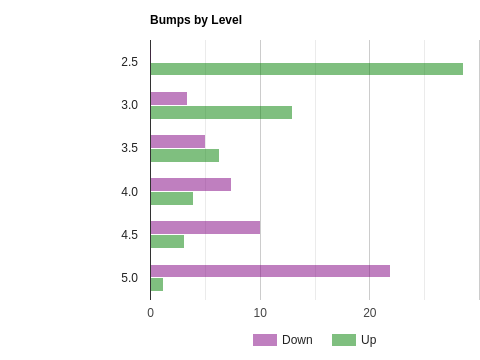
First, looking at players that appealed their year-end level up:

  • 2021 - 1,948 appeals up with 645, or 33%, bumped back down at 2022 year-end
  • 2019 - 2,443 / 729 / 30%
  • 2018 - 2,018 / 630 / 31%
  • 2017 - 1,765 / 552 / 31%
  • 2016 - 1,866 / 574 / 31%

This shows a pretty clear trend of around a third of appeal ups being "inappropriate".

What about appeal downs?  Here that is:

  • 2021 - 3,307 appeals down with 1,060, or 32%, bumped back up at 2022 year-end
  • 2019 - 4,706 / 1,544 / 33%
  • 2018 - 3,123 / 1,400 / 45%
  • 2017 - 2,151 / 834 / 39%
  • 2016 - 2,122 / 834 / 39%
Here we see a higher percentage, but not quite as consistent year to year, of appeal downs being "inappropriate".

What do you think?  Do these stats tell us anything about whether the appeal system is working as intended?  Is it a concern that 30-40% of appeal players go back to their pre-appeal level?

Monday, December 5, 2022

Analyzing 2022 USTA NTRP year-end ratings - Who appeals and in what direction?

Next up in our analysis of 2022 USTA NTRP year-end ratings, we take a look at appeals.

We aren't even a week post ratings release, and not everyone that is going to try to appeal has done so so these stats could change, but many that want to appeal will do it right away so I think it is still worthwhile to take a look now.

First, my analysis shows that 2,633 player have successfully appealed, 1,476 of them down and 1,157 up.  For comparison, for 2021, 4,107 appealed down and 2,335 appealed up.

Where it gets more interesting is when splitting it out by gender.  Of the 1,476 appeals down, 632 of them were women and 844 were men.  That is a similar ratio to 2021, perhaps a bit more heavy towards men.  But for appeals up, it switches and women do it more with 953 women and just 204 men.  Again, this is a similar ratio to 2021.

So more women appeal up than down, and a lot more men appeal down than up.

But part of this may have to do with the levels players are at.  It is generally the case that lower rated players are more likely to appeal up and higher rated ones are more likely to appeal down.

Here are the appeals down and up for women using the appealed from level.

  • 2.5 - 0 / 670
  • 3.0 - 191 / 753
  • 3.5 - 449 / 390
  • 4.0 - 622 / 52
  • 4.5 - 411 / 2
  • 5.0 - 165 / 0
  • 5.5 - 18 / 0
And the men.
  • 2.5 - 0 / 71
  • 3.0 - 46 / 188
  • 3.5 - 473 / 148
  • 4.0 - 835 / 54
  • 4.5 - 626 / 7
  • 5.0 - 254 / 0
  • 5.5 - 17 / 0

We see that a lot of 2.5 and 3.0 women appeal up, and interestingly more 3.5s appeal down to 3.0 than up to 4.0.  At 4.0 and above there are very few appeals up and the majority are down.

The men also have more appeals up at 2.5 and 3.0 and that swaps at 3.5 and by a much larger ratio than the women with 3x appealing down vs the women vs just 15% more for the women.

What do you think?

Analyzing 2022 USTA NTRP year-end ratings - Bump rates by level and gender

Continuing on with my analysis of 2022 USTA NTRP year-end ratings, I take a look at bumps rates by level, both overall and by gender.

Here are the overall bump rates by level.


We can see 2.5s are only bumped up and not down, nearly 13% of 3.0s are bumped up vs under 4% being bumped down, 3.5s are close to even, and then at 4.0 and above there are more bump downs than up.

Let's see how it is by gender as well.  The women:


Not a whole lot different from the overall, just fewer bump ups once you get to 3.5 and above.

And here are the men:


As you'd expect, just a slight difference with more bump ups at most every level.

Stay tuned for more.

Sunday, December 4, 2022

Analyzing 2022 USTA NTRP year-end ratings - Section bump rates by gender

The USTA published 2022 year-end NTRP ratings last week so that means it is time to start doing some analysis to see what we can learn.

To start, we'll look at bump rates overall and by section including by gender.  In all the charts below, it is showing the percentage of players bumped down (purple) or up (green).

First, the overall rates were:

  • Stayed - 86.1%
  • Bumped up - 8.3%
  • Bumped down - 5.6%

This is very consistent with most years.  For the women:

  • Stayed - 85.7%
  • Bumped up - 8.7%
  • Bumped down - 5.6%
And then men:
  • Stayed - 86.9%
  • Bumped up - 7.6%
  • Bumped down - 5.5%
Not a lot of variation, the men are bumped up slightly less than the women, the bump down percentages are about the same.

Here are the overall bump rates by section.


Unlike many years in the past where some sections have significantly higher bump up rates, we see that the bump rates are remarkably similar across the sections.  Just Hawaii, with slightly more bump downs than bump ups, and Northern, with just slightly more bump ups than down, don't fit the profile of most of the other sections where bump ups were about 50% higher than bump downs.

Taking a look at the same stats but by gender, here are the women.


Nothing is remarkably different here.  Just Hawaii and Northern are about equal bump up/down rates, and with a little variation the rest have about 50% more bumps up than down.

And the men.


Here we see a few sections with more than 50% greater bumps up than down like Eastern and perhaps Florida.  Southwest is also close to near equal and Hawaii has a lot more bumps down than up and Missouri Valley is near equal.

Stay tuned for more.