Showing posts with label 2016. Show all posts

Sunday, December 1, 2019

What USTA League players will be bumped up/down Monday when ratings are published?

The USTA League season wrapped up back in November and now that we've had Thanksgiving, it is time for year-end NTRP ratings to be published!

Word is that ratings should be published on Monday December 2nd, my guess is towards the end of the day, and a lot of people will be interested to see where they end up.  Some players had good years and are anticipating (or afraid of?) being bumped up, others had middle of the road seasons and expect to stay the same, while others perhaps had losing seasons and are afraid (or hoping?) for a bump down.

My ratings, while not perfect, are a very good indicator of where a player's rating will end up, and I can do still do reports for player's wanting to see where they will end up, or looking for an explanation of why they ended up where they did.

But, we can also look historically at some statistics of how past years have ended up to get an idea of what will happen this year.

What follows is a table showing bump down/up percentages by year and level for the past few years.

201820172016
Level   Up   Down   Up   Down   Up   Down
2.535%0%32%0%29%0%
3.014%3.1%14%2.9%14%3.1%
3.57.6%4.1%7.2%4.0%7.8%3.7%
4.04.7%5.9%4.3%5.7%4.8%5.2%
4.54.4%8.2%3.9%8.3%3.6%7.8%
5.01.9%17%1.6%17%1.7%17%
5.50.7%39%0%36%0%45%

We see the percentages are quite consistent for most levels, but in general there have been a slight increase in bump ups the past two years, and the bump downs have also had a small increase at several levels.

But given how consistent the bump percentages have been, it is probably pretty safe to assume 2019 will show very similar bump percentages as shown above.

Stay tuned, I'll be posting more stats and observations once year-end ratings are published.

Update: Updated the above table in this post adding in 2019 for comparison.

Sunday, March 12, 2017

What has the 40 & over division done to scheduled and matches per team? Interesting Tennis League Stats

Through 2012, USTA League had an 18 & over division and then a "Senior" division that was for those 50 & over.  In 2013, this changed to add a 40 & over division and change the existing Senior division to 55 & over.

I occasionally hear discussion about participation in the 40 & over league, if it is really needed/different from the 18 & over, and if it was just a way for the USTA to charge members to play in another league and make more money.  So looking at some stats is in order.

I've written about league participation before, but the quick summary is that in 2016 there were about 200K participants in 18 & over and 125K in 40 & over.  That likely means a lot of 40+ folks play in 18+, but 18+ is certainly still serving a large group of folks.

18 & over participation:


40 & over participation:


One can't dispute the claim that the USTA is making more money by giving those over 40 two divisions to play in.  But those players do get to play more right?

Some believe or have observed that when the split happened, the seasons for the leagues became a bit shorter, necessary in order to fit two separate seasons into the calendar.  So, I went about looking at the number of team matches played in 2012 and then successive years after the split.


In the chart above, we see that teams on average played just over 9 regular season matches per season, and since then both the 18+ and 40+ leagues have dropped to just under 9 for the 18+ and closer to 8 for 40+.

Based on this, the data does support the observation that on average, teams do have a few fewer matches.  For 18+, about one of every three teams played one match less than before the split, and 40+ has just played fewer from the start.

So it is correct that adding the 40+ league has not doubled the playing opportunity for those over 40, but it is pretty close as the matches per team has dropped only slightly.

Friday, March 3, 2017

Playing up - Is it good or bad for USTA League play? Interesting Tennis League Stats

[Warning: This is a longer blog post with lots of statistics, but please do read through to the end!]

USTA League play is intended to encourage matches to be played by players of similar ability and is accomplished through the use of the NTRP rating system.  This assigns players a level based on match results, and then player join teams in leagues at their designated level.  While there are occasional exceptions and strange things that come out of the system, by and large, it works and most matches are competitive.

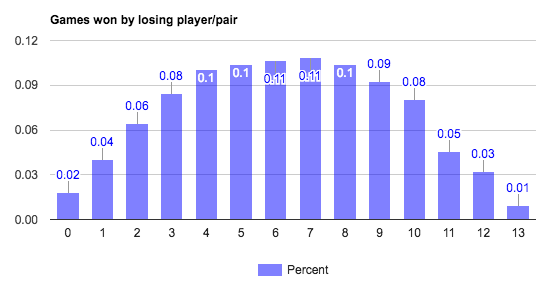
For example, in both the 18 & over and 40 & over leagues, a full 26% of matches go to a third set.  And if you define competitive as the losing player/pair winning at least four games, a full 80% are competitive.  If you go by a stricter definition of at least six games, the percentage drops to 60%, but still, for the most part, league matches are competitive.  And yes, at least five games is right in the middle at 70%.

But what about the non-competitive matches, the 20% where the losing player/pair win three or fewer games?  First, there are very few double bagels, less than 2% of matches end with that score, and barely over 4% are 1 & 0 scores.  That leaves 15% where the losing pair win two or three games.

Here is a chart showing the percentage of time the losing player/pair loses each number of games.


So, what can we see from the 20% of the matches that aren't competitive?  Using my Estimated Dynamic NTRP Ratings and looking at the difference in ratings between the winning and losing player/pair in these matches, we see it averages 0.23, a pretty big gap in favor of the winning player/pair as you might expect.  Correspondingly the difference in the competitive matches averages just 0.08, the player/pair that wins is still favored, but by a lot less.

An average rating difference of 0.23 can be achieved a few ways.  That is about half the range for a level, so can easily happen when a high 3.5, say 3.4, plays a low 3.5, say a 3.17.  But being an average, that means it is likely the rating difference is quite a bit larger at times, and it becomes more difficult for two at-level players to be playing in this case.  This means that at times, the difference is due to players playing up.

Digging deeper and looking at how many times players are playing up in non-competitive matches, we see that in singles, 28% of non-competitive matches have the loser playing up against an at-level player.  Doubles is worse with 25% of matches having one lower playing up against two at-level players, and 14% of the non-competitive matches having both losers playing up against two at-level players, meaning a full 39% of non-competitive doubles matches have at least one player playing up against at-level players.

It is not a surprise that players playing up can result in non-competitive matches, but when you see the stats, it appears one could eliminate nearly 40% of the uncompetitive matches if players weren't playing up.

Which raises the question, is allowing players to play up good or bad for USTA League tennis?

On one hand, allowing playing up accomplishes a few things:
  • Teams with a small roster of at-level players can be supplemented to have a large enough roster to ensure all five courts can be fielded each match.  Or without players playing up, at-level players may not be able to field a team as they just don't have enough.
  • Players right at the threshold of being bumped up can challenge themselves against stronger players to help them try to improve their game.
  • When players right at the threshold play up and get matched up against lower rated at-level players, it can be a competitive match between players with ratings just 0.1-0.2 apart.

But on the other hand, there are some negatives:
  • Those playing up are often over-matched leading to uncompetitive matches.  This can happen especially when the playing up player is sacrificed on court 1 to try and allow their team to win courts 2 and 3.  And since anyone can play up, you could have a 2.51 "3.0" playing up against a 3.50 "3.5", a full point apart.  This goes against the purpose of the NTRP system and league tennis, to have competitive matches, and can be considered a waste of time for the at-level player to have to take the time and expense to drive to perhaps an away match and perhaps pay court fees to play a "joke" of a match.
  • Ratings can easily be skewed as the NTRP system doesn't work well or take into account some of the unavoidable by products of matches between players rated far apart.  For example, if a strong at-level player plays a weak below level player, the at-level player may be expected to not give up a game.  If they simply get lazy or purposely lose some games, or just want to be nice and not dish out the double bagel, their rating will drop and the below level player's rating will go up inappropriately.  If this happens several times, player's ratings can move enough that an unjustified bump up or down can occur.

Unfortunately for those that see the negatives as a big issue, USTA regulations don't put many limitations on playing up.  They allow up to 50% of a roster to be below level players.  And there are no restrictions on how many can be in a given line-up.  This means it is possible for an entire line-up to be below level players.

Now some sections do adopt their own rules that limit the below level players to a smaller percentage, but there are also provisions by National that all sections adopt that allow for more than 50% to be below level if the team went to Nationals the prior year and moves to a higher level flight as a team.

If one were to want to allow playing up, but try to address some of the negatives, a few things could be done:
  • Playing up could be outlawed so it isn't allowed at all.  This likely isn't going to happen.
  • The number of below level players in a line-up could be limited and perhaps be just two or three.  This would limit how often players with a large ratings discrepancy face each other.  This seams reasonable.
  • The plus leagues (40+ 4.5+ and 18+ 5.0+) have specific rules about how many above level players can be rostered (3 or 4) and play in a match (2), and also what court they must play on (1 singles or doubles), so something similar could be done for players playing up.  Limit the number to say 2, and mandate that they must play on 2 singles or 3 doubles.  This would preclude using low rated below level players as sacrificial lambs on court 1.  This also seems reasonable.
  • Introduce restrictions on who can play up, for example require that a player's year-end rating have been in at  least the upper half or even 25% of their level to preclude the lower rated below level players from playing up.  This would mean the USTA would have to disclose this information, and they tend to like to keep it all a secret, but in Georgia they have regular and "low" leagues which effectively is disclosing the same information.  So perhaps this could be done.

I'll be honest, I'm torn on the subject.  I do tend to lean towards limiting playing up and/or having some restrictions.  But I actually fall into the camp of captaining a team that needed players playing up to field a line-up and while I always played my available and healthy at-level players over below level players, I still had to run a few below level ones out every match, although it was usually just one or two and was three only once.

But I would probably support the third bullet above, adopt something similar to the plus leagues for players playing up.  That still allows it, but limits the negatives.

What do you think?  Should players be allowed to play up?  If so, should there be some restrictions of some sort?

Monday, February 20, 2017

What about by NTRP level? More interesting league stats on bumps for players that go to Nationals

I've written about some general stats and stats by gender for the bump rates of players on teams that go to Nationals, now it is time to break it down by level.

And this is where it starts to get more interesting as players improve at different rates at different levels, in fact you'd expect the lower levels to have more bumps up as there is more room and a better chance players will improve quickly.  As you can see below, that is generally, true, but there are a few surprises.

As before, we'll start with 18+ and look at players on Nationals team rosters.


Here we do see that the level with the most bumps up is the 2.5 level with nearly half of the players on Nationals rosters being bumped up.  But somewhat surprisingly, there is a higher percentage of 3.5s bumped up (43.1%) than 3.0s (38.7%).  After that, it does drop as you might expect, but still 18% of 4.5s and 15.8% of 5.0s get were bumped up.

Here are the same stats for 18+ for those that played in matches at Nationals.


Looking at those that actually played at Nationals we see the ~5% increase across the board, but the 3.0s still have a smaller percentage bumped up than the 3.5s.

Moving on to 40+.  First the rostered players.


Here we don't see a clear trend that lower levels end up having more bumps up with 3.0 thru 4.0 all being right at 33-34%.  There is a drop at the 4.5 level though.  This does make sense in a way as you'd expect the 40+ crowd to be more likely to be at their right level, even at the lower levels, and it is more consistent in the number of players that improve regardless of level.  That is until you get to 4.5 where there are fewer players capable of getting to 5.0.

Then for completeness, the 40+ players that played at Nationals.


We again see the ~5% increase, although perhaps surprisingly the 4.0 level jumps all the way to 40%.

I know, your next request is to see by level and gender.  That is coming!

Sunday, February 19, 2017

More analysis on being bumped if you go to Nationals - Men vs Women - Interesting Tennis League Stats

I wrote yesterday about the bump percentages for players that are on teams that go to and play at Nationals.  I only looked at the high level stats and naturally it can be broken out a variety of different ways.

The first is by gender as you wouldn't necessarily expect men and women to be bumped at the same rates.

Here are the same charts as the previous analysis, but split out by women and men.  First the 18+ on Nationals rosters.


Here we see that the women have a far larger number of players rostered on Nationals teams, but the percentage that are bumped up is quite a bit lower at 28.6% vs the 34.7% for the men.  Either the men are more likely to be improving, or the men in 18+ have more of a tendency to sandbag.

Then those that played at Nationals.


The women still have more players that played at Nationals, but the gap in what percentage  are bumped shrinks a bit as the women go up to 35.4% and the men nearly get to 40%.

Moving on to 40+.


Women's rosters are still bigger, but not the same way they are in 18+.  And here the women are the ones bumped up at the far higher rate, 32.5% while the men are barely over a quarter at 26.1%.  This may be stereotyping, but it appears women in the 40+ crowd are more likely to still be improving while the men are more likely to have plateaued.  Or maybe over 40 women are more likely to be sandbaggers?

And looking at those that played at 40+.


Both bump up percentages go up significantly, the women to 37.6% and the men to almost 30% at 29.7%.

What do you think?  What observations do you have?

Saturday, February 18, 2017

If you go to USTA League Nationals, will you be bumped up? Interesting Tennis League Stats

A fairly commonly held belief is that if a player goes to Nationals, they will, or should, be bumped up.  We know this doesn't happen though, and it causes much consternation among a few that think it is unfair that someone goes to Nationals and doesn't get bumped up and so has a chance to go back again at the same level.  There are of course other rules that preclude the same team going back at the same level, e.g. the move-up/split-up rule where only three members from a team that goes to Nationals can be on the same team at the same level the following year.

But back on topic, I did some research to see how many Nationals players actually do get bumped up so we could see some real statistics on the subject.

First, I took a look at all the players on the roster of an 18+ Nationals team that held a 2015 year-end C rating and ended 2016 with a C rating.


This revealed that 67.3% stayed the same level, 31.2% were bumped up, and perhaps surprisingly, 1.5% were bumped down!

Now, some teams have large rosters and not everyone is at the top of their level and "Nationals caliber", and not all players will actually go and play in a match.  Here is how it looks if just those that played in a match are included.


Here the bump up rate goes up to 37.2% while the stay rate is 61.9% and just 0.1% of these are bumped down.  This probably makes sense, the players on a roster that don't play are likely lower rated so removing them the rate goes up, but the bump up percentage is still below 40% which goes against the perception that if you go to Nationals you will be bumped up.

Second, I did the same for 40+.  Here is the rostered player chart.


For those on Nationals rosters, 67.8% stayed the same, 29.5% were bumped up, and 2.7% were bumped down.

Then the players that played at Nationals.


Of those that played, 63.9% stayed the same, 33.9% were bumped up, and 2.1% were bumped down.

These 40+ numbers probably make sense, the bump up rate is lower in the first place as those 40+ are less likely to be improving as much and the bump down rate is higher as there are older players more likely to be on the decline.  And we see a similar small increase in the bump ups looking at the players that actually play.

Note, that this analysis did not include self-rates, and the self-rates that make it to Nationals could very well have higher bump up rates.  I'll try to do this analysis soon.

Also, even just the 18+ and 40+ analysis above can be sliced a variety of different way including by gender, by level, and also looking at the teams that made the semis.  If there is interest, leave a comment here or on Facebook and let me know what you'd like to see!

Saturday, January 14, 2017

The USTA publishes a nice summary of 2016

Those of you that get e-mails from the USTA probably got one yesterday with a link to a 2016 year in review.  It includes some boilerplate statistics on participation (not as many stats as I give you though 😀) plus a mention of plans for 2017 Nationals to include the new USTA National Campus.

There are several "up close and personal" stories on several of the teams/individuals that went to Nationals.  It then includes a short blurb on each Nationals event/level, some sounded eerily like the recaps I did after many of the events.

They also include the Nationals schedule for 2017 which matches what I wrote about recently.  So you can begin to plan your own road to Nationals for this year!

All in all, a nice summary of the year.

Monday, January 2, 2017

USTA League participation by year, is tennis shrinking? - More interesting tennis league stats

In my post from Monday on USTA League player distribution by level, I mentioned an overall drop in how many players had computer ratings for the end of 2016.  To expand on that, here are some participation numbers from 2016 to shed some more light on the subject.

All the charts in this analysis are looking at the number of players to played in Adult leagues (18+, 40+, 55+, 65+) during the 2016 rating year (roughly November 2015 thru October 2016).  For comparison, I'm including the same data from the past three years so we can see trends.

First, here are the national stats, overall and by men and women.


We can see that there are not any radical changes from year to year, but across the board, overall and for each gender, the numbers have been shrinking the past few years.  The women have dropped over 6K since 2013 while the men have just less than 6K fewer players participating in the analyzed leagues.  This represents a 4.4% drop over the three years.

As I mentioned last year when I looked at similar stats, one must understand the data they are looking at.  This analysis looks at just the main Adult leagues, and while they are shrinking, it is possible some of the secondary leagues like Tri-Level or Combo or other singles/doubles leagues run within the sections are not.  And there is a lot of tennis played outside of USTA League so this doesn't not necessarily mean tennis as a whole is shrinking.

As I did before, we can look at the trends by division.  Looking at just 18 & over, we see the downward trend more clearly.


There is the same roughly 12K drop here, but being based off a total over 200K, the percentage is larger, 5.7%.

If we look at the 40 & over league though, there is growth, particularly for the women.

And similar growth is shown in 55 & over too.

So as noted last year, it appears there are fewer players playing in the 18-39 age range, but more playing that are 40+.

But the overall decline is not occurring in every section.  Here for example is the overall chart for the Pacific Northwest section.

We see there has been small growth, about 500 or 4.2% over the three years.

The Southern section has had significant shrinkage though.

That is a drop of about 5K over the three years, or about 6.6%.

Texas had shown a drop but recovered some this year.

The drop was about 800 or 4% but went back up 200 in 2016.

Southern Cal is another section that is growing.

Their count has gone up about 700 or 6.8%.

I can do more sections if there is interest.  Let me know.


Happy New Year! USTA League player distribution by level - More interesting tennis league stats

Happy New Year!  I hope everyone rang in the new year safely, and at least in my area, we are starting our 2017 40+ league right away, my team's first match is this coming weekend.  But before we look forward to 2017, here is another post looking back at 2016.

Specifically, this is taking a look at how many computer rated players ended 2016 at each level and comparing it with the same numbers from 2015.

Note, in doing the comparisons, I show there were about 2,000 fewer players that were computer rated at the end of 2016 than 2015, so that is partly the reason why some levels may have fewer players this year.  This decline continues what we've seen the past few years interestingly enough.

First the women:

First, we can see that the more women are 3.5s than 3.0s or 4.0s by a pretty wide margin.  But looking at trends from 2015 to 2016, we can see that the 2.5s and 3.0s went up a bit, but the number of players that ended 2016 as 3.5s, 4.0s, and 4.5s all dropped slightly.

Next the men:

For the men, the 3.5s and 4.0s are neck and neck with the 4.0s staying just ahead of the 3.5s last year.  We also see more 2.5s and 3.0s, but fewer players at 3.5, 4.0, and 4.5 like we did for the women.

Given that there were more players bumped up than down in ever section, it is a bit surprising to see the decline at higher levels and would seem to indicate that some players at higher levels did not play enough matches to get a year-end rating.  It would also support the notion that most new players join at the 2.5 and 3.0 levels as that is where the growth was despite the overall loss of players.

What do you think?  In your area, are there fewer players playing and is the loss at the higher levels?

I'll probably look at the same data by section or state and will do the most requested first, so let me know where you are from!

Tuesday, December 20, 2016

They're back! Christmas Estimated Dynamic NTRP Rating Reports, a great stocking stuffer

As I've done the past few years, I'm offering PDF versions of Estimated Dynamic NTRP Rating Reports, perfect as a stocking stuffer or last minute gift for that hard to buy for USTA playing tennis friend or family member.  The PDF of the report will be provided at no extra charge and you'll still get my explanation of the report in the e-mail I send with the PDF.

Here is what the PDF will look like.


Contact me to request a report or with any questions.  And Happy Holidays!

Sunday, December 11, 2016

2016 USTA League NTRP rating bump percentages by section for the 4.0 level - Interesting tennis league stats

I've looked at the bump up/down percentages for the 3.0, 3.5, and 4.5 levels.  Now the 4.0 level for men and women by section.

Here are the percentages of bumps up and down from 2015 for the 4.0 women.


Here we see a mix of some sections having more bumps up than down (4) and some vice versa (13), but none with even 8% going either way, so this was a relatively stable level.  Midwest did have the most bump downs while Eastern, Pacific Northwest, and Southern Cal were in a virtual tie for the most bumps up.

And the same for the 4.0 men.

This is not as balanced as the women, there were a lot more sections with more bumps up (13) than down (4), and Southern Cal had over 9% of their 4.0 men bumped up, and Caribbean, Florida, and Middle States weren't far behind.


Thursday, December 8, 2016

2016 USTA League NTRP rating bump percentages by section for the 4.5 level - Interesting tennis league stats

I've looked at the bump up/down percentages for the 3.0 and 3.5 levels.  Now the 4.5 levels.

Here are the percentages of bumps up and down from 2015 for the 4.5 women.


Among a bunch of sections that had 2-4 times as many players bumped down than up, Caribbean somehow ended up with nearly 10% of their 4.5s bumped up.  Southwest went way the other way with over 15% of their 4.5 women bumped down.

And then the same for the 4.5 men.


The thing that jumps out here is that Hawaii had a remarkable number of bump downs for players that were at the 4.5 level.  Most other sections had more bump downs than up, but at over 17% Hawaii led the way.

Interestingly, Northern and Eastern are the only sections that had more bumps up than down.


Wednesday, December 7, 2016

2016 USTA League NTRP rating bump percentages by section for the 3.0 level - Interesting tennis league stats

Next up in the analysis of 2016 USTA League year-end bump ups is the 3.0 level.

Here are the 3.0 women bump percentages by section.


At the 3.0 level, there are a lot more bumps up than down, not a big surprise as players improve.  And for the 3.0 women Southern Cal and Southwest lead the way with around 19% of players bumped up, with Caribbean not far behind.  And no section had fewer than 10% bumped up.

Hawaii had virtually no bump downs, and no section had more than 5% bumped down.

Here are the bump percentages for the 3.0 men.


And we have a winner!  Hardly any 3.0 men were bumped down, and over 40% of Southern Cal 3.0 men were bumped up!  And these don't include self-rates, these are just players that were 2015 year-end 3.0Cs and improved this year to 3.5.  Nice weather encourages folks to play and improve, or there were a lot of sandbaggers in 2015 getting C ratings.

Tuesday, December 6, 2016

2016 USTA League NTRP rating bump percentages by section for the 3.5 level - Interesting tennis league stats

The USTA published year-end ratings last week, and I took a first look at some bump percentages by section, now it is time to start looking at things by NTRP level.  First, the 3.5 level by section.

Here are the bump percentages for the 3.5 women by section.

We see that Southern Cal had the most bumps up, nearly 10% of 2015 year-end C rated 3.5 women being bumped up.  The Pacific Northwest and Texas are close behind with Southwest and Missouri Valley right around 7.5%.  At the other end of the spectrum, Hawaii was at just over 5% bumped up while Mid-Atlantic and Middle States were right around 6%.

No section had more bump downs than up, but Northern was the closest with over 5% of 3.5 women bumped down and on the other end of things, Southern Cal had under 3% bumped down.

And then the bump percentages for the 3.5 men by section.

The 3.5 men also saw the most bumps up in Southern Cal, nearly 14%.  This is a bit surprising given the section didn't even have their team make the semis at Nationals.  Texas finished second at Nationals and had over 12% bumped up, and no section had less than 7% bumped up.

Southern Cal, Florida, and Texas had the fewest bumps down at well under 2%.

Friday, December 2, 2016

2016 USTA League NTRP rating bump percentages, overall and by section - Interesting tennis league stats

It has been a couple days since the 2016 USTA year-end NTRP rating levels were published, so as the dust settles it is time to start doing some analysis to see what we can learn.

This is the first in what is sure to be a series of posts looking at how many players were bumped up or down, slicing the data by section, level, and more.  For the purposes of this analysis, I'm looking at the changes for players that were 2015 and 2016 year-end computer rated.

First, overall, 87% of players stayed at the same level, with 4% bumped down and 9% bumped up.  Keep this in mind as we take a look at the data by section.

By comparison, last year at 2015 year-end, 8% were bumped up and 4.7% bumped down.  So not a radical change at all, a similar ratio of bump ups to downs, and similar numbers overall.

And here is the overall data by section.


The chart shows things were actually quite consistent from section to section.  There is the usual large number of bump ups in Caribbean, but nearly every other section is in the range of 7-10%.  Southern Cal, which did well at Nationals, is the highest after Caribbean, and then Texas and Pacific Northwest.  Southern is somewhat surprisingly fifth after being my Section of the Year, but with so many players in the section it would be hard to bump the entire section up!

Bump down were also quite consistent, being right around 4-5% in nearly every section.

The above includes both genders together.  What about if we look at them individually?

Here is the chart by section for women.


This is actually quite consistent with the overall stats.  Pacific Northwest is now second behind Caribbean, but you still have Southern Cal, Texas, Southern, and Southwest close behind.  Being a strong section traditionally, Northern Cal had a surprisingly large number of bump downs, the highest percentage of any section!

And here is the chart by section for the men.


As you might imagine, the men aren't wildly different.  Southern Cal actually beats out Caribbean for the highest bump percentage, and Hawaii leads the way for bump downs.

If you look at the same charts from 2015, there appears to be a lot less variation, the sections are a lot more consistent.  It appears the USTA did not see the need to make any mass adjustments, at the section level at least, which is a bit surprising given how a few sections continued to dominate at Nationals.

What do you think?  Were are the bump percentages what you expected?

If you are interested in knowing more about your specific rating, I'm still doing reports for 2016.


Thursday, December 1, 2016

What? No way! Why? Understanding your 2016 year-end NTRP rating

The 2016 USTA League year-end NTRP ratings are out, and many players received the year-end rating they were expecting.  But some individuals may still be surprised with where they ended up.

There are always some surprises for players.  Some may have been expecting to stay where they were but got bumped up or down, while others may have won a lot and were expected a bump up, or lost a lot and thought they'd be bumped down, and neither happened.

I will be doing some analysis to look at what happened and if there were any surprises or adjustments made by the USTA and reporting a variety of stats, but for those that want to understand why they were/weren't bumped up/down, they can always get an Estimated Dynamic NTRP Rating Report that will help explain how it all works.  While my ratings aren't perfect, they usually can explain odd bumps or lack thereof.  Contact me for more information.

Wednesday, November 30, 2016

2016 USTA NTRP year-end ratings are published!

The wait is over, the USTA has published the 2016 year-end NTRP Ratings.  At least some are now showing at 2016 year-end ratings.

USTA League players may now furiously go check their rating on TennisLink and see whether they were bumped up or not and begin figuring out what team(s) they can play on.

Stay tuned for more details as I look at the ratings and do my analysis.

Monday, November 28, 2016

BREAKING NEWS! 2016 year-end ratings may not be published today!

I wrote yesterday that folks should be ready for ratings to come out today as that is the traditional timing for them, but that I'd heard rumors of a possible delay.  I've now had several other sources seemingly confirm that, although the exact day is still not known.  I've heard everything from this Thursday, this Friday, and next week.

I now believe that while I'm sure the USTA will try to get the ratings out as soon as they can, it likely won't be today.  In the past, I recall a notice showing up on TennisLink indicating when they planned to publish and I do not see that yet, so either they don't know for sure or are choosing not to share and keep us in suspense.

I'll post more as I learn more as well as soon as I see any new ratings published.

Update: As of 10am PDT on 11/28, my LC informed captains that National plans to publish the ratings this Thursday 12/1.  She emphasized it is a planned date and could change and she does not know what time on Thursday.

Sunday, November 27, 2016

Are you ready for 2016 USTA year-end NTRP ratings? Teams are forming now for 2017!

Thanksgiving has passed and that means we now anxiously await year-end NTRP ratings to be released by the USTA as they are traditionally published this week.

I would expect them to be released on Monday, but a few players from sections other than my own have told me they heard it will be later in the week.  I'd still expect them earlier than later though.

And this is important in many sections as teams may begin playing their 2017 season right away in January, so teams are forming now and recruiting is taking place.  In fact, in my area (Pacific Northwest, Northwest Washington) our team forms are due in one week, so even if ratings are out on Monday we don't even have a full week to make sure a team can be fielded, and those players bumped up or down may be in hot demand or have to find a new team to play with.

Stay tuned to this blog or the NTRP Ratings Facebook page as I'll announce as soon as I hear/see ratings are out and follow that up with a variety of analysis on the year-end ratings and what we can tell from them.

Thursday, November 24, 2016

Happy Thanksgiving, another Black Friday sale on Estimated Dynamic NTRP Rating Reports!

It is Thanksgiving, that means the USTA will be publishing 2016 year-end ratings soon, and as I did last year, I'm offering some discounts on Estimated Dynamic NTRP Rating Reports Friday the 25th through Sunday the 27th.

Not only does a report give you a very good idea of where your rating will end up, but also shows a bevy of statistics for your 2016 season including a chart showing match by match how each match rated and affected your dynamic rating, plus you get a partner report showing how your matches rated when playing with your different doubles partners.


This year, I am again offering discounts on new individual reports of 25% off and new team reports of 33%.  And if you have the need for a custom report for recruiting, I'll give discounts on those too.

Sunday the 27th will come soon, so don't delay in requesting a report.  Contact me if interested (ratings@teravation.net), and have a great Thanksgiving weekend!