Showing posts with label bumps. Show all posts

Friday, December 1, 2023

Analyzing 2023 USTA NTRP year-end ratings - What strange or unexpected bumps were there?

2023 USTA NTRP year-end ratings are out and I've taken a look at bump rates by section and by level, and before slicing the data more, I thought I'd take a step back and just look for edge case bumps we don't see often or appear to be glitches in the system.

First up, the double bump.  Bumps up and down happen, in typical years about 15% of players are bumped, around 9% go up and 6% go down.  It varies from year to year but that is roughly what you can expect.  Bumps up or down just one level are the most common of course, but do double bumps happen?  If so, how often?

For bumps up, I show 29 players whose 2023 year-end C rating was at least 1.0 higher than their C rating they were using for 2023.  So it does happen, but not a lot.  What about a triple bump up?  I found one, sort of, but it was actually a glitch (see below).

For bumps down, I only found one player that has this, sort of.  I say sort of because they were a 2022 year-end 4.5C, but were able to appeal down to 4.0, and at 2023 year-end received a 3.5C.  So they were a double bump down, but "benefited" from appealing down and being able to play 4.0, although they still played 4.5 and only played one Tri-Level match on the 4.0 court.  To be honest, the 3.5C doesn't appear warranted, but the USTA gave it to them.

There is always interesting year-end ratings around some players that go to Nationals.  Here are a few I've seen that are a little baffling:

  1. A team finishes 3rd at Nationals, and no one is bumped up other than a player who went 4-5 on the year.  Others on the roster won 70+% of their matches on the year including 3-0, 4-1 or 5-1 at Nationals and weren't bumped up.
  2. A 5.5C takes time off and comes back as a 5.0S and goes 9-0 including 4-0 at Nationals and gets a 4.5C.

For what it is worth, my ratings don't agree with either of the above.

How about some bumps that appear to be glitches or bugs or due to something other than the algorithm?

  • A 5.0C takes time off and comes back as a 5.0S and goes 1-2 playing 5.0.  What is their year-end rating?  2.5C!  Clearly something amiss here, I'm guessing it will be fixed and changed at some point, and in fact as I just checked as I write this it has been, so good on the USTA for fixing it.  I saw a few more similar to this that have also been fixed.
  • A 3.5S played in 2022 and was DQ'd to 4.0 mid-year, but somehow got a 2.5C year-end rating.  Clearly a glitch and it was fixed, but not for months it seems so the 4.0C they got this year looked like a triple bump but wasn't once the fixed 4.0C from last year was recorded.
  • A 4.5S plays only Mixed, loses two matches early, then goes 14-1 and gets an M rating as expected, but it is a 4.0M!  My ratings had them closer to a 5.0 than a 4.0.
  • A 5.0T self-rates as a 5.0 and plays 5.0, does go 0-3, but ends up as a 3.5C!

For some of these that are glitches, the USTA does correct them as I note so that is good.  But a few are outstanding and make one scratch their head.

What crazy bumps have you seen?

Thursday, November 30, 2023

Analyzing 2023 USTA NTRP year-end ratings - Section bump rates by gender

The USTA published 2023 year-end NTRP ratings about 24 hours ago, so that means it is time to start doing some analysis to see what we can learn.

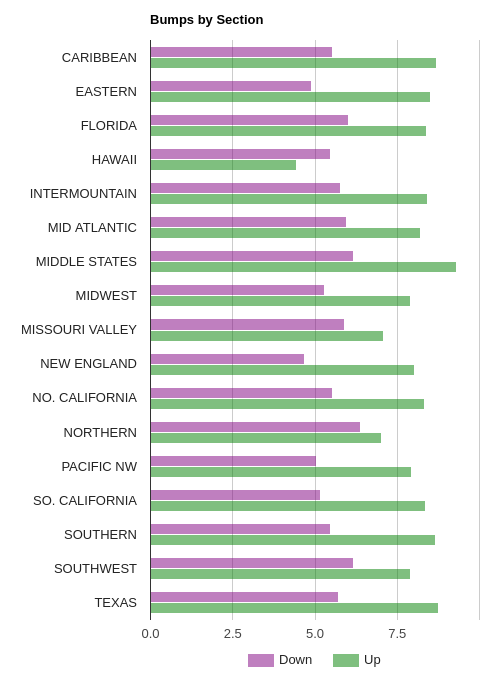
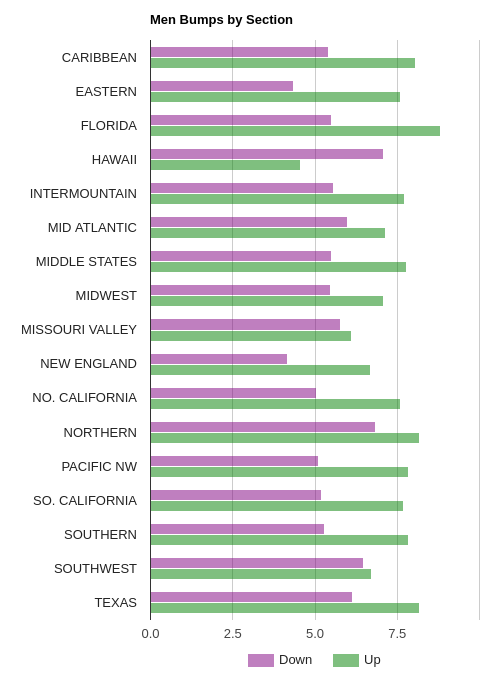
To start, we'll look at bump rates overall and by section including by gender.  In all the charts below, it is showing the percentage of players bumped down (purple) or up (green).

First, the overall rates were:

  • Stayed - 84.9%
  • Bumped up - 9.5%
  • Bumped down - 5.6%

This is very consistent with most years.  For the women:

  • Stayed - 84.5%
  • Bumped up - 9.7%
  • Bumped down - 5.7%
And then men:
  • Stayed - 85.6%
  • Bumped up - 9.1%
  • Bumped down - 5.3%
Not a lot of variation, the men are bumped up slightly less than the women, the bump down percentages are about the same.  The number that stayed the same level is down about 1% point from last year.

Here are the overall bump rates by section.

Last year was pretty consistent across sections, but this year is even more so.  Every section had more bumps up than down, between 8 and 10% bumps up and around 5% bumps down.  No section stands out having an abnormally high number of bumps up.  Generally speaking, there were no radical changes to adjustments.

Taking a look at the same stats but by gender, here are the women.

Nothing is remarkably different here.  NorCal does get over 11% bumps up, but still pretty consistent.

And the men.

Texas is the only one over 9% at around 11% and some other variation, but nothing more significant as far as radical changes between sections.

Stay tuned for more.


Monday, December 5, 2022

Analyzing 2022 USTA NTRP year-end ratings - Who appeals and in what direction?

Next up in our analysis of 2022 USTA NTRP year-end ratings, we take a look at appeals.

We aren't even a week post ratings release, and not everyone that is going to try to appeal has done so so these stats could change, but many that want to appeal will do it right away so I think it is still worthwhile to take a look now.

First, my analysis shows that 2,633 player have successfully appealed, 1,476 of them down and 1,157 up.  For comparison, for 2021, 4,107 appealed down and 2,335 appealed up.

Where it gets more interesting is when splitting it out by gender.  Of the 1,476 appeals down, 632 of them were women and 844 were men.  That is a similar ratio to 2021, perhaps a bit more heavy towards men.  But for appeals up, it switches and women do it more with 953 women and just 204 men.  Again, this is a similar ratio to 2021.

So more women appeal up than down, and a lot more men appeal down than up.

But part of this may have to do with the levels players are at.  It is generally the case that lower rated players are more likely to appeal up and higher rated ones are more likely to appeal down.

Here are the appeals down and up for women using the appealed from level.

  • 2.5 - 0 / 670
  • 3.0 - 191 / 753
  • 3.5 - 449 / 390
  • 4.0 - 622 / 52
  • 4.5 - 411 / 2
  • 5.0 - 165 / 0
  • 5.5 - 18 / 0
And the men.
  • 2.5 - 0 / 71
  • 3.0 - 46 / 188
  • 3.5 - 473 / 148
  • 4.0 - 835 / 54
  • 4.5 - 626 / 7
  • 5.0 - 254 / 0
  • 5.5 - 17 / 0

We see that a lot of 2.5 and 3.0 women appeal up, and interestingly more 3.5s appeal down to 3.0 than up to 4.0.  At 4.0 and above there are very few appeals up and the majority are down.

The men also have more appeals up at 2.5 and 3.0 and that swaps at 3.5 and by a much larger ratio than the women with 3x appealing down vs the women vs just 15% more for the women.

What do you think?

Sunday, December 4, 2022

Analyzing 2022 USTA NTRP year-end ratings - Section bump rates by gender

The USTA published 2022 year-end NTRP ratings last week so that means it is time to start doing some analysis to see what we can learn.

To start, we'll look at bump rates overall and by section including by gender.  In all the charts below, it is showing the percentage of players bumped down (purple) or up (green).

First, the overall rates were:

  • Stayed - 86.1%
  • Bumped up - 8.3%
  • Bumped down - 5.6%

This is very consistent with most years.  For the women:

  • Stayed - 85.7%
  • Bumped up - 8.7%
  • Bumped down - 5.6%
And then men:
  • Stayed - 86.9%
  • Bumped up - 7.6%
  • Bumped down - 5.5%
Not a lot of variation, the men are bumped up slightly less than the women, the bump down percentages are about the same.

Here are the overall bump rates by section.


Unlike many years in the past where some sections have significantly higher bump up rates, we see that the bump rates are remarkably similar across the sections.  Just Hawaii, with slightly more bump downs than bump ups, and Northern, with just slightly more bump ups than down, don't fit the profile of most of the other sections where bump ups were about 50% higher than bump downs.

Taking a look at the same stats but by gender, here are the women.


Nothing is remarkably different here.  Just Hawaii and Northern are about equal bump up/down rates, and with a little variation the rest have about 50% more bumps up than down.

And the men.


Here we see a few sections with more than 50% greater bumps up than down like Eastern and perhaps Florida.  Southwest is also close to near equal and Hawaii has a lot more bumps down than up and Missouri Valley is near equal.

Stay tuned for more.


Wednesday, November 17, 2021

What might the results from 2021 USTA League Nationals mean for year-end bumps? And why did some sections do so well?

I took a look at how each section did at Nationals, both at a high level and by division, and several sections did very well, Southern, SoCal, and Florida topped the list, while others struggled to make the semis more than a couple of times.  One logical question is why it can be so lopsided, and another is what it might mean for year-end ratings?

On the first question, I think there are several contributing factors.

One is that some sections just have more densely populated areas, so more players to pull from, so it isn't necessarily that a top 4.0 in section A is better than a top 4.0 in section B, rather section A just has more top 4.0s to form teams from and so they are a deeper team.

Another is that the road to Nationals for some sections is more grueling than others, and the team that survives and advances is more battle tested and prepared for Nationals and able to pull out the close matches.  Southern teams for example generally have to go through local playoffs, State playoffs where it is multiple flights leading to semis and a final, and then Sectionals where it is against multiple flights leading to semis and a final.  Many other sections may only have two rounds of playoffs, and a given round may involve just round-robin, or two small flights and a final.  Less matches in pressure situations may not prepare a team for Nationals as well.

It is also possible that despite the USTA's best intentions, their year-end benchmarking doesn't perfectly level the playing field across the sections.  For example, at 2019 year-end, Southern had a large number of players bumped up, but then in something of a reversal, suddenly a lot of players were able to appeal down.  It may be that the mass bump up was justified and would have leveled the playing field, but allowing the appeals tilted things in Southern's direction again.

But another big factor this year is that this is a 2-year rating period and there were no bumps in 2020.  This means there are players that had two years to improve and be clearly out of level now, but still be eligible to play at their 2019 year-end level at Nationals.  While this could happen in any section, it is more likely to happen in sections where more tennis could be played year-round, for example where COVID restrictions didn't close indoor courts for periods, and guess what, Southern, SoCal, and Florida certainly fit this definition.

What do you think?  Why did some sections do significantly better than others this year?

On to the next question of what all this means for 2021 year-end ratings.

I already wrote about Intermountain's success in the 18 & Over division, particularly for the women, and that that might mean more bump ups in the section than normal.  For the same reason, Southern, SoCal, and Florida very well could expect to see more bump ups than normal.

We know the USTA, whether with an override or as part of the normal year-end calculations, tends to have higher bump rates for sections that do well at Nationals, and in some years some sections are hit hard in what appears to be attempt to level the playing field.

What is unknown is if the USTA will feel compelled to make any adjustments this year with the 2-year rating period, or exactly how the 2-year rating period will affect things, or if things will just change organically.

My League Coordinator has already notified captains in our league starting in January that are now forming teams that they may expect more players to be bumped up than normal due to the 2-year rating period.  If that is true as a baseline, and sections that did well at Nationals get an even higher rate, we may see some "interesting" bump rates in two weeks when ratings are published.

What have you heard, or what do you think will happen?

Saturday, November 6, 2021

Is Intermountain going to bear the brunt of the USTA's 2021 bump ups?

At year-end when the USTA does their year-end ratings and players are bumped up or down, not all sections are treated equally.  Some sections get far more bump ups than others, see the analysis I did at the end of 2019 and 2018 where you can see the bump rates can vary significantly by section.

One might wonder, what is this based on?  Why would the USTA bump up a lot more players in one section than another?

The answer is the year-end calculations the USTA does try to level the playing field across all of the sections, so that a 3.5 in Southern California is relatively the same as a 3.5 in New England, or a 4.0 in Southern is relatively the same as a 4.0 in Northern.

A key factor in the year-end calculations is how each section does at Nationals.  If one section does really well at Nationals, that is probably an indication that their players are stronger than players in other sections and to level things, more bump ups may be in order.  In the past Southern, PNW, Caribbean, and Texas have all been sections to get abnormally high bump up rates, and this generally correlates with how the section did at Nationals.

So who is in line to get the big bump up rates in a month when year-end ratings come out?

Intermountain appears to be a key candidate.  Here is how they did at 18 & Over Nationals:

  • 18 & Over 2.5 women - semis
  • 18 & Over 3.0 women - finals
  • 18 & Over 3.0 men - champs
  • 18 & Over 3.5 women - finals
  • 18 & Over 3.5 men - 8th
  • 18 & Over 4.0 women - 14th
  • 18 & Over 4.0 men - champs
  • 18 & Over 4.5 women - semis
  • 18 & Over 4.5 men - 7th
  • 18 & Over 5.0 women - semis
  • 18 & Over 5.0 men - 8th

In a full 7 out of 11 events Intermountain made at least the semis, made the final 4 times, and won twice.

In 40 & Over, it wasn't as clearly dominant, but in the 8 events there were 2 that made the semis and two others finished 5th.

Who knows what will happen with the USTA dealing with a 2-year rating period, but my guess is Intermountain may get and justify a higher than normal number of bump ups, certainly at several levels.

What do you think?

Friday, December 6, 2019

Digging in to the Great Southern Bump of 2019 - Level distribution by state

I wrote yesterday about how men in the Southern section were bumped up at significantly higher rates than the national averages.  I also took a look at the distribution of players by level in Southern compared to national averages.

The logical next step is to drill into the data and see if whatever was done was done consistently throughout the section or if some states were more/less impacted.

As a reminder and baseline, here is the distribution of Southern men by level.


See the earlier posting for all the details, but key thing is that there were and are still more 3.5s than 4.0s, and there were nearly twice as many 3.0s as 4.5s but those counts are now basically equal.  Nationally there are about the same 3.5s and 4.0s and roughly the same 3.0s and 4.5s.

Alphabetically, we will start with Alabama.


Alabama definitely had 2.5s and 3.0s bumped up, and given the influx of them there were 3.5s bumped up too, although just a modest drop in count.  There were a lot of 4.0s bumped up as the count went down despite the influx and the 4.5s were the beneficiaries, that count went way up as did the 5.0s.  There are now significantly more 4.5s than 3.0s, but still more 3.5s than 4.0s.

Next, Arkansas.


Arkansas did have players bumped up from 2.5 through 3.5, those counts did go down from 2018 to 2019, but 4.0s and above had their counts go up, supportive of the hypothesis that there was a general redistribution towards the higher levels.  Note that Arkansas still has fewer 4.0s than 3.5s but a lot closer than before, and it is nearly equal between the 3.0s and 4.5s.

Next, Georgia.


Georgia was only modestly out of whack with the national averages, but has almost no 2.5s now and 3.0s were bumped up too.  More 3.5s were bumped up than came in and while there were a lot of bumps up to 4.5, the 4.0s grew.  Georgia is now very close to the national averages with about the same number of 3.0s as 4.5s and 3.5s as 4.0s.

Next, Kentucky.


Kentucky had bump ups at 2.5 and 3.0, but a lot at 3.5 given their count went down even with the bump ups coming in 4.0 was the beneficiary with a big increase.  4.5 and 5.0 also went up significantly.  There are now significantly more 4.0s than 3.5s and 4.5s than 3.0s.  Kentucky was perhaps a state that did not need an adjustment to align with national averages, but still got it.

Next, Louisiana.


Louisiana also had bump ups, there are hardly any 2.5s anymore, and we see an increase in the number of 4.0s, 4.5s, and 5.0s.  They are not yet to the national averages with way more 3.0s than 4.5s and noticeably more 3.5s than 4.0s.

Next, Mississippi.


Mississippi had a lot of bump ups at 3.0s and the number of 3.5s went up as a result.  There were bump ups to 4.0 but more went from 4.0 to 4.5 and 4.5 to 5.0.  Mississippi does have nearly as many 4.5s as 3.0s, but there are still a lot more 3.5s than 4.0s.

Next, North Carolina.

North Carolina had a fair number of bump ups from the lower levels, the 4.5s and 5.0s having the largest increase.  They have more 4.5s than 3.0s now, and just a few fewer 4.0s than 3.5s.  They have more 4.5s than 3.0s, but still a few more 3.5s than 4.0s.

Next, South Carolina.


Just a small percent of 2.5s bumped up, but quite a few 3.0s went to 4.0, with a lot of 3.5s to 4.0, and 4.5 and 5.0 both picked up some players.  They are still biased towards the lower levels with a lot more 3.0s than 4.5s and a lot more 3.5s than 4.0s.

Last, Tennessee.


There are some remarkable changes here.  2.5s are non-existent, and nearly all 3.0s were bumped up to 3.5 where the count of 3.5s nearly tripled!  There had to be some bump downs from 4.0 for that to happen and the 4.0s stayed about the same while the 4.5s and 5.0s here took precipitous drops.  Tennessee is clearly an exception to the general bump up across the levels trend.  This probably deserves more research on its own.

What do you think?  Does this dovetail with what you've seen with your friends and teammates?

Thursday, December 5, 2019

The Great Southern Bump of 2019 - USTA Southern men get historic bump up rates

I've been going through my post-NTRP ratings published analysis and what was a little smoke when looking at bump up/down rates at a high level has turned into a raging fire as I've drilled in.

Here is a summary of what I've posted so far regarding bump up rates of players that had a C rating at the end of 2018 and 2019.
  • 2.5 men - Southern had 75% bumped up, nationally 52%
  • 3.0 men - Southern had 33.1% bumped up, nationally 21.8%
  • 3.5 men - Southern had 18.2% bumped up, nationally 11.2%
  • 4.0 men - Southern had 17.8% bumped up, nationally 10.9%
  • 4.5 men - Southern had 19.8% bumped up, nationally 6.7%
  • 5.0 men - Southern had 6.3% bumped up, nationally 1.5%

The Southern men had the highest bump up percentage among all the sections at every level!  And it was significantly above the national average, usually 60+% greater, but about 3 times greater for 4.5s and 4 times for 5.0s.  It is pretty much unheard of for there to be nearly 20% of 4.5s bumped up and anywhere close to 6% of 5.0s.

That begs the question, what has this done to the distribution of players across the levels?  Let's look again at the distribution nationally for the men.


In this chart, it shows stats for both 2018 and 2019 to easily see the change year to year, and the length of the bar is the number of players at that level, while the label at the end of the bar is the percentage of players at that level that year.

We see a "normal" distribution, the center being just about right between 3.5s and 4.0s.  And compared to 2018, not a dramatic change, the percent being 3.5 dropped slightly, 4.0s down half a percentage point, and the 4.5s up just over 2 points, with 5.0s up half a point.

Now, the distribution in Southern.


This is somewhat different in that the center of the "normal" curve is closer to 3.5 than 4.0.  We see that it has changed quite a bit though and moves closer to the mid-point between them with the 2.5 percent dropping 1 point, 3.0 percent dropping over 4 points, 3.5 dropping 0.4, 4.0 going up nearly a point, 4.5 going up a whopping 3.2 points, and 5.0 going up nearly 2 points.

Or put another way, it appears 2.5s moved to 3.0, more 3.0s moved to 3.5, but even with the influx of 3.5s the number went down slightly as just as many 3.5s moved to 4.0.  The number of 4.0s did grow, but there were still a lot that moved up to 4.5, and quite a few 4.5s moved to 5.0.

So there was a definite shift upwards which dovetails with the bump up percentages reported above.

One might ask the question, why was and is Southern biased more towards lower levels, and was the large number of bump ups a reaction to that to try and make the distribution closer to what it is nationally?  It could be that the USTA League playing population is older in Southern and happens to have more lower rated players, but clearly it is different than the national distribution, even after the noticeable bump ups.

However, an adjacent section, Florida, perhaps also with an older population of USTA League players, is actually biased slightly towards the higher rated players already.  Here is Florida's distribution chart.


Florida had some movement from 3.5 to 4.0 and 4.0 to 4.5, but already had more 4.0s than 3.5s, and more 4.5s than 3.0s unlike Southern.

So it would seem someone decided that Southern players were generally underrated, or at least out of whack with the national distribution, with a distribution biased too far towards 3.0 and 3.5, and steps needed to be taken to change that distribution and get more 4.0s and 4.5s.

What do you think?  Is the distribution of Southern's men being towards the lower levels an issue and was the redistribution needed and appropriate?

Note: "The Great Southern Bump of 2019" was a phrase I thought I coined, but an acquaintance had done so as well so credit goes to "OTL".

Wednesday, December 4, 2019

Analyzing 2019 USTA NTRP year-end ratings - Section bump rates by level and gender - 5.0 men and women

Next in my series of posts analyzing the 2019 year-end ratings I continue breaking down the bump rates by level and gender.  I already looked at bump rates for each section by gender, bump rates by level nationally, and started the by level analysis with the 3.5 men and women4.0 men and women3.0 men and women, and 4.5 men and women.

Next up the 5.0 levels.  First the women.


As you might expect, very few bumps up, only 7 sections really had any and quite a few had over 20% bumped down.

Next the men.


Here we see a lot of bump downs and very few bump ups, but yep, Southern is the exception with the fewest bump downs, less than 4% where most others were over 10% and many over 20%, and Southern had more 5.0s bumped up, over 6%, than down.

Stay tuned, more to come.

Analyzing 2019 USTA NTRP year-end ratings - Section bump rates by level and gender - 4.5 men and women

Next in my series of posts analyzing the 2019 year-end ratings I continue breaking down the bump rates by level and gender.  I already looked at bump rates for each section by gender, bump rates by level nationally, and started the by level analysis with the 3.5 men and women4.0 men and women, and 3.0 men and women.

Next up the 3.0 levels.  First the women.


As you might expect after seeing the 3.0 thru 4.0 analysis and how the bump ups go down as the levels go up, there are a lot more bump downs at 4.5.  What is interesting is that Caribbean is the section with the most bump ups at over 8%.  Only Middle States is close at just under 6%, everyone else is at 4% or lower.

Next the much awaited 4.5 men.


We see a similar trend, more bumps down at this level than the lower levels, except for Southern that had nearly 20% of 4.5s bumped up!  That is a higher percentage than the 4.0s bumped up to 4.5 and the 3.5s bumped to 4.0.  No other section was even close with only Texas at about 7.5% having noticeably more bump ups than down.  Mid-Atlantic who won 4.5 Nationals was about an even split.

I have no explanation for this.  IMHO the bump up rates for Southern at every level, but especially 4.5, can't be simply from normal year-end calculations and adjustments.  There seems to have been an agenda to adjust and/or redistribute things in Southern for some purpose for 2020.

Stay tuned, more to come.

Tuesday, December 3, 2019

Analyzing 2019 USTA NTRP year-end ratings - Section bump rates by level and gender - 3.0 men and women

Next in my series of posts analyzing the 2019 year-end ratings I continue breaking down the bump rates by level and gender.  I already looked at bump rates for each section by gender, bump rates by level nationally, and started the by level analysis with the 3.5 men and women and 4.0 men and women.

Next up the 3.0 levels.  First the women.


We see a lot more bumps up, every section has more up than down, but Caribbean leads the way at nearly 19% and Middle States, Northern, SoCal, and NoCal are all at 15% or higher.  Just Intermountain had 5% bumped down, the rest less.

This makes sense, 3.0s generally have more upside, so you would expect more bumps up.

Next the 3.0 men.


There is an even larger disparity between the bumps up and down, hardly any bumps down in any section, and Southern had nearly 33% of 3.0 men bumped up and Texas nearly 28%.  This is clearly a big reason why these two sections led the way across all levels.

But four other sections were over 20% in Caribbean (actually a fraction more than Texas), Northern, New England, and Southwest.

Stay tuned, more to come.

Analyzing 2019 USTA NTRP year-end ratings - Section bump rates by level and gender - 4.0 men and women

Next in my series of posts analyzing the 2019 year-end ratings I continue breaking down the bump rates by level and gender.  I already looked at bump rates for each section by gender, bump rates by level nationally, and started the by level analysis with the 3.5 men and women.

Next up the 4.0 levels.  First the women.


What jumps out is there are a surprising number of sections that have more players bumped down than up.  Caribbean had more the twice as many bumped down than up, but Midwest had the highest percentage at nearly 8%.  Only 5 sections had more bumps up than down, Pacific Northwest the most at over 8%, and then Southwest, Northern, and Eastern.

Next the 4.0 men.


We see the general trend of Southern and Texas having a large number of bump ups continue, Southern nearly 18%, Texas nearly 15% bumped up.  Next closest is Florida and Intermountain.  Only Caribbean and Hawaii had significantly more bumps down than up.  PNW also did narrowly, and NorCal barely had more up than down but both very lost percentages.  It appears the USTA thought NorCal and PNW had fairly rated 4.0 men with such little movement.

Stay tuned, more to come.

Analyzing 2019 USTA NTRP year-end ratings - Section bump rates by level and gender - 3.5 men and women

Next in my series of posts analyzing the 2019 year-end ratings I begin breaking down the bump rates by level and gender.  I already looked at bump rates for each section by gender, as well as bump rates by level nationally.

To start, I'll look at the 3.5 level starting with the women.


Caribbean and Southern Cal had the most bump ups, Mid-Atlantic not far behind, but these all under 10% and all of the rest under 7.5%.  No section had more bump downs than up, but Intermountain was close.

And next the men.


Here we see the trend general trend of Southern and Texas having the most bump ups applying to the 3.5 level too, Southern at over 18% and Texas nearly 15%.  Southern Cal, Northern, and Missouri Valley were each over 10% as well.  Only Southwest had more than 5% bumped down.

Monday, December 2, 2019

Analyzing 2019 USTA NTRP year-end ratings - Section bump rates by gender

2019 year-end ratings have been published, and my analysis has begun.

I already took a look at bump rates by level comparing to past years, now on to some bump rates by section and gender.

Here are the overall bump rates by section.


We see some typical bump rates of 8-10% up and 4-5% down, but there is some variation by section.  Southern and Texas lead the way with bump ups with 13% and 11% respectively, Caribbean and Middle States at 10.2% and Mid-Atlantic at 10%.  Hawaii had the fewest bump ups at just over 7%, very close to their bump downs.  Caribbean joined Hawaii with the most bump downs but still under 7%.

But it is more interesting to look at things by gender too.  Here are the women.


There are no big outliers, but Caribbean, Mid-Atlantic, Middle States, and Northern are all just over 10%.  Hawaii and Missouri Valley had the fewest bump ups but still over 7%.

The men had more variation, here they are.


We see that Southern and Texas are the big outliers, Southern having over 21% of men bumped up!  Texas at nearly 14% would be high in most years as well.

With a section as large as Southern, a lot of bump ups numbers wise is expect, that this is an awfully high percentage and would seem to indicate some kind of adjustment.  This has happened in past years with other sections, Caribbean was last year with an astounding 45% bumped up, and Caribbean and PNW were over 20% in 2014, so Southern and to a lesser degree Texas have been singled out this year.

This mirrors the anecdotal evidence I'm hearing, but it will be interesting to split it out by level too.  Stay tuned for that.

2019 USTA NTRP bump rates by level - Interesting Tennis League Stats

The USTA has published their 2019 year-end ratings and since I had just posted general bump up/down rates by level, I thought I'd update the table with the latest bump data.

What this table is showing is the players at a given level that were bumped up.  Specifically for example, 7.6% of 3.5s that were 2017 year-end 3.5s were bumped up to 4.0, and 4.1% were bumped down.  So the new data added is now showing that 8.1% of 2018 year-end 3.5s were bumped up to 4.0 and 4.0% were bumped down.

Here is the full table.

2019201820172016
Level   Up   Down   Up   Down   Up   Down
2.532%0%35%0%32%0%29%0%
3.014%3.2%14%3.1%14%2.9%14%3.1%
3.58.1%4.0%7.6%4.1%7.2%4.0%7.8%3.7%
4.07.2%5.6%4.7%5.9%4.3%5.7%4.8%5.2%
4.55.0%7.7%4.4%8.2%3.9%8.3%3.6%7.8%
5.01.4%20%1.9%17%1.6%17%1.7%17%
5.50%37%0.7%39%0%36%0%45%

The most noticeable change is that the bump up rate for 4.0s is significantly higher than past years, 4.x for three years but 7.2% for 2019.  That is a huge jump nationally and across genders and I'm sure there will be pockets where that is much higher (stay tuned for that).  The bump down rate for 4.0s was not significantly lower though.

4.5s also had a higher bump up rate but not nearly as much as the 4.0s.

Based on this, it would seem the USTA may have thought there was a glut of players at the top of the 4.0 range and did a little adjusting up, and perhaps also a bit with 4.5s to get a few more 5.0s.

I will work on all my normal analysis in the coming days, but wanted to get this out quickly.  Also, I'll look at slicing this data by gender and section/state too.

Update: Bump rates by section and gender here.

Sunday, December 1, 2019

What USTA League players will be bumped up/down Monday when ratings are published?

The USTA League season wrapped up back in November and now that we've had Thanksgiving, it is time for year-end NTRP ratings to be published!

Word is that ratings should be published on Monday December 2nd, my guess is towards the end of the day, and a lot of people will be interested to see where they end up.  Some players had good years and are anticipating (or afraid of?) being bumped up, others had middle of the road seasons and expect to stay the same, while others perhaps had losing seasons and are afraid (or hoping?) for a bump down.

My ratings, while not perfect, are a very good indicator of where a player's rating will end up, and I can do still do reports for player's wanting to see where they will end up, or looking for an explanation of why they ended up where they did.

But, we can also look historically at some statistics of how past years have ended up to get an idea of what will happen this year.

What follows is a table showing bump down/up percentages by year and level for the past few years.

201820172016
Level   Up   Down   Up   Down   Up   Down
2.535%0%32%0%29%0%
3.014%3.1%14%2.9%14%3.1%
3.57.6%4.1%7.2%4.0%7.8%3.7%
4.04.7%5.9%4.3%5.7%4.8%5.2%
4.54.4%8.2%3.9%8.3%3.6%7.8%
5.01.9%17%1.6%17%1.7%17%
5.50.7%39%0%36%0%45%

We see the percentages are quite consistent for most levels, but in general there have been a slight increase in bump ups the past two years, and the bump downs have also had a small increase at several levels.

But given how consistent the bump percentages have been, it is probably pretty safe to assume 2019 will show very similar bump percentages as shown above.

Stay tuned, I'll be posting more stats and observations once year-end ratings are published.

Update: Updated the above table in this post adding in 2019 for comparison.

Thursday, December 6, 2018

Analyzing 2018 USTA NTRP year-end ratings - bump rates by league/division played

A common question I get is whether a 55 year-old 4.0 is the same as a 25 year-old 4.0.  The short answer is yes, they are supposed to be.  But there is a lot behind that answer.

I say yes because the NTRP system is based on match results.  If a 55 year-old plays a 25 year-old, the result of that match will be factored in to each player's rating and the relative ratings between them should be accurate.  If the 25 year-old 4.0 is better than the 55 year-old 4.0 and wins easily, the 25 year-old's rating will go up, the 55 year-old's will go down.  If either goes up or down enough, they could be bumped up or down at year-end.

Correspondingly, anyone that plays either of those players will have their rating calculated appropriately.  If the 55 year-old is a "low" 4.0, then wins against that player won't rate as high as a win against the "25 year-old "high" 4.0.

Now, for this to work, there must be some amount of play between the older/younger players so the groups are "connected" so to speak.  This generally happens enough, a fair number of 55+ players do play 18 & Over, or the 55+ players will play 40 & Over and there will be 40+ players they play there that play 18 & Over.

But there still seems to be a perception amongst some that the ratings don't get it right, and some 55+ players have inflated ratings and when they play against a 25 year-old of the same level, it isn't a competitive match.

Now, there is a lot more to a match than just comparing ratings, one player may be a "high" at-level player and another "low", so a 6-2,6-2 win for the 25 year-old may be expected.  Similarly, if they play singles and the 55+ player has achieved their rating from primarily doubles but isn't as strong a singles player, that may explain it.  And playing styles and how those match up is always a factor.

Generally, you might expect players ratings to gradually drop as they age and so the older players may be in the lower part of the range for their level.  But at the same time, if they are going down and just got bumped down, they may be in the higher part of the range for their level..

All of this begs the question, what are the bump rates among players of different ages?  Unfortunately I don't have player's ages, but we can use the league/division they play in as a proxy for age.

Below are charts that show the bump up/down rates for players based on the division they played in.  Note that players aged 40+ and 55+ can play in the lower age divisions so they may be counted potentially in each division.

First, for the women.

We do see that players that play 18 & Over are bumped up a lot more, nearly 2.5 times more, than down.  The 40 & Over division is similar but closer to 2 times more.  But the 55 & Over has a significant drop and there are slightly more bump downs than up.

This is largely as you'd expect given I noted above that older players will eventually see their skills or mobility diminish, and you'd expect younger players to have a higher ceiling to improve into.  It is perhaps surprising those in 40 & Over are still bumped up over twice as much as down, but that is likely due to some players picking up the game in their 40's and having room to improve.

Next, for the men.

We see a very similar trend.  So similar I don't really have much to add.

But the above is across all levels and that is where you may see new players at any age still improving along with those on the decline.  What about if we look at the higher end of the levels, say the 4.5 level for the men?


Interestingly, we see more bumps down than up in every division, although the ratio definitely gets larger as you move up in age.  It is especially interesting and surprising for at least me, that even for those age 55+ that there are more than 2% that play in that league bumped up.  If we are to believe the ratings, more than 2% of 55+ players are still improving, and improving enough to cross the threshold to be a 5.0!

I'm certainly not going to say that older players can't improve, but improving from a 4.5 to a 5.0 is a pretty tall task and 1 in 40 4.5 rated players age 55+ doing it seems a pretty big ask.

One might ask if the USTA is inflating or keeping some older player's ratings too high?  I know I've heard from some older players that have been bumped up saying there is no way they can play against younger players at 5.0, it almost becomes a safety issue, and there are few or limited playing opportunities for a 55+ 5.0 player.  The result is they can't play much and are stranded, or have to somehow find a way to play younger players and get killed (hopefully not physically!) to get their rating adjusted and get bumped down.

I don't know that the USTA does this, but I could see some reasoning being that if you don't bump players up, or let them be bumped down, it is unfair to the lower rated at-level players to have stronger ones beating up on them, and you end up with a glut of players with too large a range at a given level.  One solution to avoid the glut at a level would be to bump more of those lower rated within players down, but since everyone has at least a bit of an ego, those bumped down might not like the idea of that or having to play at the lower level won't be fun for them and decide to quit playing USTA League.

What do you think?  Are older player's ratings inflated a bit?  Is there not enough "connectedness" between the age groups for the system to work as hoped?  Or is the USTA just keeping players rated at higher levels to avoid a glut of 55+ players at the 3.5 and 4.0 levels that don't want to be bumped down?

Update: For completeness, here is the same chart as above for the 4.5 women.


Analyzing 2018 USTA NTRP year-end ratings - 3.0 men bump rates by section

Continuing with my analysis of year-end ratings and bump rates, here are the bump rates for the 3.0 men by section.


At approaching 60% of 3.0 men bumped up, Caribbean again leads.  This is a huge number of bump ups, I don't know I've ever seen such a high rate at the 3.0 or above level.  So we again do the chart without Caribbean.


There are some high bump rates here too, higher than the 3.0 women in fact, most sections around/over 15%.  Hawaii is approaching 30% though which is quite high, and New England, SoCal, Florida, and Texas are around/over 20% too.  There are still some bump downs, but very few.

More to come.

Analyzing 2018 USTA NTRP year-end ratings - 3.0 women bump rates by section

Continuing with my analysis of year-end ratings and bump rates, here are the bump rates for the 3.0 women by section.


Caribbean again leads, and is well over 45% at this level, but if anywhere, the lower levels are where you'd expect high bump rates.  Regardless, we again do the chart without Caribbean.


There are a lot of higher bump up rates here.  Every section other than Middle States and Eastern are over 10%, and Northern and Southwest well over 15%.  There are still a not insignificant percentage bumped down though, most sections around 3-4%.

More to come.

Tuesday, December 4, 2018

Analyzing 2018 USTA NTRP year-end ratings - 4.5 men bump rates by section

Continuing with my analysis of year-end ratings and bump rates, here are the bump rates for the 4.5 men by section.


Caribbean again leads, at just over 45% at this level which is surprising given that as the levels goes higher the trend typically switches from more bumps up to more bumps down.  So we again do the chart without Caribbean.


Here we see the largest percentage bump goes to Hawaii 4.5s being bumped down at over 13%.  They still had over 3% of their 4.5s bumped up though.  Middle States, Midwest, and New England also had a lot of bump downs, so look for them to perhaps have strong 4.0 teams next year.

The largest percentage of 4.5s bumped up goes to SoCal, and almost more up than down.  Mid-Atlantic, Missouri Valley, and NorCal were close behind.

More to come.