Showing posts with label 2022. Show all posts

Sunday, October 15, 2023

2023 USTA League Nationals Week 3 Recap

Week three of 2023 USTA League Nationals is complete.  Here is a recap.

The 18 & Over 3.0 women saw NorCal beat PNW and SoCal beat Eastern, both by 4-1 scores, with NorCal winning the California battle 5-0.  NorCal was the overwhelming favorite in the simulation and they came through, and could have a double bump up or two.

The 18 & over 3.0 men, Southwest lost to Eastern 4-1 and NorCal lost to Texas 3-2, and then Texas won the final 4-1.  Texas was one of the favorites, and with a host of self-rates won it all.  It isn't uncommon to have a lot of self-rates at the 3.0 level, but all but one of the players who played at Nationals was a self-rate and many will be clear bump ups.

The 40 & Over 4.5 women saw Northern beat Texas 3-1 and Intermountain beat Middle States 4-0 before Northern won the final 4-0.  Northern was a contender and came through with four players appealing down from 5.0 and another just bumped down.

The 40 & Over 4.5 men saw Florida and Texas each advance 3-1 over Eastern and Southern, then Florida "won" the final 2-2 when they were tied on sets and managed to win 2 more games.  This was perhaps the closest final we've seen.  Florida was one of the favorites and won it with five players rostered who were 5.0s last year.

Congratulations to the new Nationals winners.

Thursday, July 6, 2023

Another look at what NTRP rating combinations works best in Mixed 18 & Over? More Interesting Tennis League Stats

I've been looking at how different combinations of levels do in the 55 & Over Adult and 18 & Over Mixed, and just took a deeper dive on 55 & Over, so the same deeper dive on Mixed is in order.

The general observation has been that unbalanced pairs, e.g. a 4.5 and 3.5 in an 8.0 flight, tend to win more often than not, and this deeper dive will take a look at if this is actually expected or not based on the current ratings of the players.

The deeper dive on 55 & Over revealed that while the unbalanced pairs do win more often, they are always expected to, and often fall short of the expected winning percentage.  This may indicate a selection bias of sorts, where it is possible that only stronger players at their level opt to play as an unbalanced pair, thus skewing the stats in their favor, and there is not some inherent advantage to unbalanced pairs.

So on to taking a closer look at Mixed.  Specifically, I narrowed the matches analyzed to only those where I had an established rating for all 4 players and then looked at not just how often unbalanced pairs won, but how often they were expected to win.  The results were certainly interesting, and a bit different from what we saw for 55 & Over.

Note, the actual winning percentages are slightly different from the earlier post because some matches where the players didn't all have ratings have been filtered out.

For each level/gender below, I'm using 2022 18 & Over Mixed league data again and showing the percentage of the time the unbalanced pair won, followed by the percentage of the time the unbalanced pair had the higher combined ratings.  When the actual is higher than the expected, the unbalanced is overachieving, and when the actual is lower than the expected, they are underachieving.

The ratings used for this analysis are my Mixed Exclusive Estimated Dynamic NTRP Ratings I use for doing the various individual, team, and flight reports I offer.  The pairings are showing the male then female levels.

Starting with 6.0:

  • 3.5/2.5 vs 3.0/3.0 - 52.0% actual, 57.1% expected - underachieved
  • 3.5/2.5 vs 2.5/3.5 - 53.7% actual, 41.1% expected - overachieved big
  • 2.5/3.5 vs 3.0/3.0 - 48.0% actual, 59.3% expected - underachieved big

The 6.0 level can be tricky with a lot of new/unknown players at times, but we see the pairs with the higher rated male player win more often, and this is especially true when it is a 3.5 male vs a 2.5 male and the 3.5 male really overachieves vs expected.

But like I said, 6.0 is tricky, so on to 7.0 where players are a little less volatile:

  • 4.0/3.0 vs 3.5/3.5 - 58.7% actual, 56.4% expected - overachieved a bit
  • 4.0/3.0 vs 3.0/4.0 - 56.3% actual, 51.7% expected - overachieved
  • 3.0/4.0 vs 3.5/3.5 - 49.7% actual, 53.3% expected - underachieved

We again see the pair with the higher rated male wins more often, and we also see some over achievement for the 4.0/3.0 pairs.

Next, 8.0:

  • 4.5/3.5 vs 4.0/4.0 - 57.8% actual, 54.9% expected - overachieved
  • 4.5/3.5 vs 3.5/4.5 - 52.4% actual, 48.9% expected - overachieved
  • 3.5/4.5 vs 4.0/4.0 - 54.2% actual, 53.2% expected - overachieved a bit

The trend of unbalanced pairs overachieving continues by a decent 3-4% margin for the 4.5/3.5 pairs.

Next, 9.0:

  • 5.0/4.0 vs 4.5/4.5 - 61.6% actual, 53.6% expected - overachieved big
  • 5.0/4.0 vs 4.0/5.0 - 59.1% actual, 55.0% expected - overachieved
  • 4.0/5.0 vs 4.5/4.5 - 56.6% actual, 54.6% expected - overachieved a bit

The over achievement for unbalanced pairs is seen here too.

The counts for 10.0 are so low there is no point to doing the analysis here.

Given we see some to significant over achievement for the unbalanced pairs, especially at the higher levels, it may be that there is an inherent advantage in Mixed.  This is perhaps because at higher levels, players are able to employ strategies maximizing the difference in abilities taking advantage of having the stronger player.

It could also be that for the lower level player of unbalanced pairs, only the top players at that level self-select to play, and that gives an inherent ratings advantage over two "average" players on a balanced pair.

What do you think?

Wednesday, July 5, 2023

Another look at what NTRP rating combinations works best in Adult 55 & Over? More Interesting Tennis League Stats

A few days ago I took at look at what ratings combinations win the most in 55 & Over Adult league play.  What I found was consistent with earlier analysis I've done and that is that unbalanced pairs, e.g. a 4.0/3.0 pair in 7.0, beat balanced pairs, e.g. a 3.5/3.5, more than they lose.

What some pointed out, and I knew I wanted to do more research into, is that while the unbalanced pairs win more, that may be because of a selection bias of sorts, where it is possible that only stronger players at their level opt to play as an unbalanced pair, and the fact they win more often may be expected.  It is even possible that while they win more than lose, they may not win as often as expected.

For example, at 7.0, it may be that it is the strong 3.0s that are attracted to play or perhaps are recruited to play.  That means when they (say a 2.90 3.0) partner with an average 4.0 (3.75) vs two average 3.5s (3.25), the rating comparison is 6.65 vs 6.50, and the unbalanced pair has the higher combined ratings and thus is arguably expected to win.  Even if the 3.5s are a bit better (3.30) it is still 6.65 vs 6.60.

With that in mind, I went about digging deeper.  Specifically, I narrowed the matches analyzed to only those where I had an established rating for all 4 players and then looked at not just how often unbalanced pairs won, but how often they were expected to win.  The results were certainly interesting, if not a bit surprising.

Note, the actual winning percentages are slightly different from the earlier post because some matches where the players didn't all have ratings have been filtered out.

For each level/gender below, I'm using 2022 55 & Over Adult league data again and showing the percentage of the time the unbalanced pair won, followed by the percentage of the time the unbalanced pair had the higher combined ratings.  When the actual is higher than the expected, the unbalanced is overachieving, and when the actual is lower than the expected, they are underachieving.

The ratings used for this analysis are my Estimated Dynamic NTRP Ratings I use for doing the various individual, team, and flight reports I offer.

For the women:

  • 6.0 - 3.5/2.5 vs 3.0/3.0 - 48.7% actual, 54.7% expected - underachieved
  • 7.0 - 4.0/3.0 vs 3.5/3.5 - 54.6% actual, 54.5% expected - nearly perfectly as expected
  • 8.0 - 4.5/3.5 vs 4.0/4.0 - 56.2% actual, 62.3% expected - underachieved
  • 9.0 - 5.0/4.0 vs 4.5/4.5 - 66.9% actual, 73.7% expected - underachieved

Here we see the selection of matches change the actual percentages slightly, and at 6.0 the unbalanced actually lost slightly more than they won, but at three of the four levels, while the unbalanced won more, they were expected to win more than they did, so arguably underachieved.

For the men:

  • 6.0 - 3.5/2.5 vs 3.0/3.0 - 58.6% actual, 58.6% expected - exactly as expected
  • 7.0 - 4.0/3.0 vs 3.5/3.5 - 55.6% actual, 51.1% expected - overachieved
  • 8.0 - 4.5/3.5 vs 4.0/4.0 - 55.4% actual, 56.3% expected - slightly underachieved
  • 9.0 - 5.0/4.0 vs 4.5/4.5 - 50.9% actual, 55.2% expected - underachieved

Here the actual percentages vary a bit more with the selected matches, especially at 9.0.  And we also see that at 6.0 it is exactly as expected, the unbalanced overachieve at 7.0, but 8.0 has a slight underachieve and 9.0 a significant underachieve.

So, it may not be quite as clear cut as the earlier analysis showed.  While unbalanced pairs do win more than they lose, it appears it is because it is the right unbalanced pairs are playing and they are expected to win because they are higher rated overall, not just because they are an unbalanced pair.  And they may not even win as often as expected.

What do you think?  Is this more in-line with your experience than the initial analysis was?

Monday, July 3, 2023

What NTRP rating combinations works best in Mixed? More Interesting Tennis League Stats

I wrote yesterday about what ratings combinations work best for 55 & Over Adult play, today, I thought I'd start a refresh of the ratings combination analysis for Mixed I did around 8 years ago.

To start, I'll look at 18 & Over Mixed.  For reference, here is the post I did 8 years ago for the same division.

This time I will include 6.0 and 10.0 levels I omitted last time.  For each pairing I list, the first number will be the male level and the second the female level.

Starting with 6.0:

  • 3.5/2.5 pairs beat 3.0/3.0 pairs 52.7% of the time
  • 2.5/3.5 pairs beat 3.0/3.0 pairs 49.6% of the time
  • 3.5/2.5 pairs beat 2.5/3.5 pairs 56.2% of the time

Here, a slight to significant advantage to unbalanced when the male is the higher rated player.  The 2.5/3.5 is ever so slightly below 50%.

Next up, 7.0:

  • 4.0/3.0 pairs beat 3.5/3.5 pairs 58.3% of the time
  • 3.0/4.0 pairs beat 3.5/3.5 pairs 50.8% of the time
  • 4.0/3.0 pairs beat 3.0/4.0 pairs 55.1% of the time

This is similar to before (60%, 52%, 57%) so that form continues to hold.  Unbalanced with the higher rated male has the advantage, but unbalanced with the higher rated female has a slight advantage too.

Next up, 8.0:

  • 4.5/3.5 pairs beat 4.0/4.0 pairs 57.6% of the time
  • 3.5/4.5 pairs beat 4.0/4.0 pairs 53.5% of the time
  • 4.5/3.5 pairs beat 3.5/4.5 pairs 51.7% of the time

This is a bit different from last time (61%, 51%, 60%) with the unbalanced 3.5/4.5 pairs doing better than before.  Still, unbalanced has the advantage over balanced and unbalanced with the higher rated male stronger overall.

And 9.0:

  • 5.0/4.0 pairs beat 4.5/4.5 pairs 59.6% of the time
  • 4.0/5.0 pairs beat 4.5/4.5 pairs 56.1% of the time
  • 5.0/4.0 pairs beat 4.0/5.0 pairs 58.5% of the time
This compares with 57%, 58%, 51% last time, so a bit different, but the trend holds.  Unbalanced with more frequently, and the unbalanced with the higher rated male do so over the higher rated female.

Last, 10.0:

  • 5.5/4.5 pairs beat 5.0/5.0 pairs 27.0% of the time
  • 4.5/5.5 pairs beat 5.0/5.0 pairs 62.9% of the time
  • 5.5/4.5 pairs beat 4.5/5.5 pairs 66.7% of the time

Note there is so little play at this level that some of the totals for these match-ups are in the single digits so make of that what you will.

Aside from a couple anomalies at the 6.0 and 10.0 levels, the trend continues.  Unbalanced pairs win more often in Mixed.  The advantage is not huge, most of these winning percentages are between 50% and 60%, but it is consistent.

What do you think?  Is this consistent with what you see locally?

Sunday, July 2, 2023

What NTRP rating combinations works best in Adult 55 & Over? More Interesting Tennis League Stats

A popular discussion topic for USTA League teams that use combo-levels is what the best pairings are.  I've looked at this a number of years ago for Mixed, but thought it would be interesting to take a look at Adult 55 & Over.

The candidate leagues in this case are the 55 & Over Adult leagues with 6.0, 7.0, 8.0, and 9.0 flights where players up to a full two levels apart can play together.  For example, in 8.0 the playing combinations can be 3.5/4.5, 4.0/4.0, and 4.5/3.5.  The fundamental question is, when different pairings face each other, which wins more often?

Note for this analysis I'm only considering "at-level" pairings and not those where say a 3.5 and 4.0 play together as a "7.5" pair in an 8.0 flight.

I've done this before for Mixed, both 18 & Over and 40 & Over and in nearly every case, unbalanced pairs win more often than balanced pairs, generally between 52% and 60% depending on the exact scenario.  Mixed also has different genders to add to the permutations but the strongest tends to be unbalanced with the male the higher level player where that pair wins around 60% of the time.

What I did was to take a look at Adult 55 & Over matches from 2022 and broke it out by both gender and level.

For the women:

  • 6.0 - 3.5/2.5 pairs beat 3.0/3.0 pairs 51% of the time
  • 7.0 - 4.0/3.0 pairs beat 3.5/3.5 pairs 55% of the time
  • 8.0 - 4.5/3.5 pairs beat 4.0/4.0 pairs 57% of the time
  • 9.0 - 5.0/4.0 pairs beat 4.5/4.5 pairs 66% of the time

We see unbalanced pairs have the advantage, very slight at 6.0 but growing as the level goes up.

For the men:

  • 6.0 - 3.5/2.5 pairs beat 3.0/3.0 pairs 57% of the time
  • 7.0 - 4.0/3.0 pairs beat 3.5/3.5 pairs 56% of the time
  • 8.0 - 4.5/3.5 pairs beat 4.0/4.0 pairs 56% of the time
  • 9.0 - 5.0/4.0 pairs beat 4.5/4.5 pairs 57% of the time

The men are very consistent at 56-57% of the time the unbalanced pair wins.

This is pretty consistent with the Mixed results, unbalanced pairs win more often.  They theory is that the unbalanced pairs generally have the strongest player and if they employ a strategy to minimize the lower rated partner's weaknesses, the stronger player rises to the top.  At 55-57% for most scenarios it is obviously not a given that unbalanced pairs will win, but the trend is pretty clear.

What do you think?  Is this consistent with what you see in your leagues?


Update: I did a subsequent deeper dive looking at actual vs expected results here.


Saturday, February 11, 2023

How accurate are Dynamic NTRP ratings at predicting tennis matches? 2022 edition - Interesting League Stats

It has been awhile since I took a look at how accurate my Estimated Dynamic Ratings are at predicting match results so I thought I'd take a look at how they did in 2022.

As a reminder, if you are interested in getting a detailed report using my ratings, see this post.

For this analysis, I'm looking at all matches played in 2022 in the 18 & Over, 40 & over, and 55 & Over divisions.  Unlike before, I'm going to slice the data a few different ways.

Note, these are my dynamic ratings, that largely mirror what the USTA does with their ratings but are not the USTA's ratings, so any accuracy or claims regarding predicting matches is for my ratings and not the USTA's.

First, here are the winning percentages by the higher rated player/pair across all the divisions for all matches, and then broken down by the difference between the ratings as well as singles and doubles.

Rating GapOverallSinglesDoubles
Overall72%73%72%
<= 0.0554%53%54%
0.05 - 0.1566%64%66%
0.15 - 0.2579%76%80%
0.25 - 0.3588%85%89%
0.35 - 0.4593%89%94%
> 0.4596%94%97%

These percentages are remarkably consistent with the past analysis I did.  The matches between closely rated players are close to 50/50 but the higher rated player/pair does win a little more often.  As the gap grows, the higher rated player/pair wins increasingly often.

Interestingly, the doubles percentages are generally slightly higher.  Perhaps that is due to more players on the court making it less likely that one player being really on or off has as much effect.

Taking a look at just the 18 & Over division:

Rating GapOverallSinglesDoubles
Overall73%73%72%
<= 0.0554%53%54%
0.05 - 0.1566%63%66%
0.15 - 0.2579%76%80%
0.25 - 0.3587%85%89%
0.35 - 0.4592%89%94%
> 0.4596%95%97%

These percentages are nearly identical to the overall, which makes sense since 18 & Over is the largest division and most matches.

Then just the 40 & Over division:

Rating GapOverallSinglesDoubles
Overall72%73%72%
<= 0.0554%54%54%
0.05 - 0.1566%65%66%
0.15 - 0.2580%76%80%
0.25 - 0.3588%85%89%
0.35 - 0.4593%90%94%
> 0.4596%94%97%

Very similar percentages here too, just slightly higher at the larger gaps.

And last, just the 55 & Over division:

Rating GapOverall
Overall72%
<= 0.0554%
0.05 - 0.1566%
0.15 - 0.2581%
0.25 - 0.3591%
0.35 - 0.4595%
> 0.4598%

This division is doubles only, and these percentages are basically the same as the doubles stats for the other divisions.

So it appears the ratings predict match results very consistently regardless of division, which should be the case for a good rating system.  So perhaps my ratings are sound and a good rating system!

What do you think?

Sunday, February 5, 2023

Dissecting the USTA"s 2022 tennis participation press release

Each year, the USTA has a press release or post discussing a variety of participation numbers.  This year was no different with the headline being that participation grew for a third straight year.  There are many ways to look at tennis participation, so this deserves a closer look to see what exactly grew.

Those that are regular readers of this blog know that I take a look at USTA League participation each year and there has been a general decline in the number of players playing in the main 18 & Over, 40 & Over, and 55 & Over leagues.  However, depending on how you look at 2020/2021 since league play was suspended and there were no Nationals in 2020, there has been some growth in league participation after a big drop due to COVID.  Regardless of how you look at it though, even if participation in 2022 was up from 2021, 2022 was down from 2019 (258K down to 242K) and on a similar or even quicker trajectory to prior years.

So how can the USTA claim participation grew for three straight years?  The answer is that they are using a different metric than league participation.  The number they are using is from the Tennis Industry Association (TIA) that is estimating the number of people that play tennis in the US irrespective of being part of any organized league or tournament.  The TIA is saying that 23.6 million people played tennis in 2022, up 5.9 million from the start of 2020.  I believe the TIA bases their estimate on reported sales of tennis balls or other similar sales metrics, and much of the increase is attributed to COVID and how tennis was a safe sport to play and the population has flocked to it.

You'd think that an additional 5.9 million players (33% growth) over three years would result in a larger group of players that would be interested in USTA League play, but my numbers show a decrease from 2019 of 6.2%.  Now, if the TIA's numbers are correct, the percentage of the playing population that plays USTA League is barely over 1%, so one wouldn't necessarily expect a strong correlation.  Clearly, the vast majority of tennis is not played as a part of USTA League.

That said, the USTA stated that 284K players played USTA League in 2022 and that is different from my number of 242K.  Why is that?  My number is looking at just the main Adult leagues as that is something I can do consistently from year to year.  I'm assuming the USTA's number is using all leagues and so it is larger.  By my count the number of unique players in all leagues is just over 284K as well, so I have no argument with that number and it appears accurate.

The USTA also touts 2022 having an 11% increase over 2021 and that too seems accurate by my numbers as my main Adult league count went up just over 10% and these are very close.  And 2021 was up over 2020 which is no surprise as 2020 was way down due to COVID.  It is likely that at least some of the growth in 2022 was due to 2021 still being down due to COVID and more players coming back.

The key thing is that 2022 is still short of 2019.  Whether that is because the general decline in USTA League participation has continued, or we are still suffering from the effects of COVID remains to be seen.  One would think that 2022 didn't have many players still staying away from league play due to COVID but perhaps there were some.  The league participation numbers for 2023 will go a long ways to answering the question of if the pre-2019 decline is continuing, or if the USTA can capitalize on the additional tennis playing population and convert some to league play.

While writing this blog, it occurred to me that there is another metric that could be tracked, and that is the number of players that receive a year-end rating each year.  This will include more players than my main Adult league metric as it will include Mixed and Tournament players as well as players that play in alternate leagues that count for ratings.  It won't count players that play Combo or other leagues that don't count for ratings, won't count tournament players that play non-sanctioned or non-NTRP tournaments, and won't include players that don't get the minimum three matches played.

The result of this is a metric the USTA doesn't want to publicize at is falls well short of some of the aforementioned metrics.  I show just 231K players that had a 2022 year-end rating and this was down 8.0% from the 2021 number of 251K.  This is well below the USTA's 284K and below my 242K as well.  This means that just over 50 thousand league players play leagues that don't count for ratings, or didn't play enough matches to get a year-end rating.

Note that 2021 was up 2.7% over 2019's 245K, but keep in mind that 2021 covered a 2 year period which would inherently inflate the number.

Here is the full chart for the past 10 years.

Here we see the slow but steady decline with a slight bump up in 2019 and another in the 2-year period 2021, but a drop to a level lower than any other year in 2022.  And the drop is a similar percentage for both women and men.

So, was there growth in general tennis participation?  Yes, if you believe the TIA.  But has that transferred to adult play in USTA League and those players getting year-end ratings?  It doesn't appear so, at least yet.

Will the significant growth the TIA reports in the tennis playing population find its way to USTA League play in 2023?

A summary of how USTA League 40 & Over 4-court format is encountering 2-2 ties

The 40 & Over 4-court format has been around for a few years and I've written about it numerous times, but a friend played a match last night ending in a 2-2 tie that went all the way to the court 1 winner to decide the team win, which was a healthy reminder of the format and how it works.

With that in mind, I thought I'd summarize what we've observed from league play using the format the past few years.

First, in league play, in the 2021 championship year, of the 27,795 team matches played, 7,215 (26%) were tied 2-2 with 2,934 (41%) of those being tied on sets and of those, 249 (8.4%) were tied on games and went to the winner of court 1 doubles.

In league play, in the 2022 championship year, of the 33,694 team matches played, 8.766 (26%) were tied 2-2 with 3,443 (39%) of those being tied on sets and of those, 315 (9.1%) were tied on games and went to the winner of court 1 doubles.

Nationals is where it can really come into play where the tie-breakers decide important matches.  While the format was put in place for 2020, there were no Nationals that year so we start this summary with 2021.

At 2021 40 & Over Nationals, there were 292 team matches played with 84 (29%) of them ending in a 2-2 tie.  Of those, 31 (37%) were tied on sets, and of those, 3 (9.7%) were tied on games and went to the winner of court 1 doubles.

At 2022 40 & Over Nationals, there were 298 team matches played with 72 (24%) of them ending in a 2-2 tie.  Of those, 25 (35%) were tied on sets, and of those, 4 (16%) were tied on games and went to the winner of court 1 doubles.

If we summarize it all then, we get:

SeasonTied 2-2Sets TiedGames Tied
2021 Regular Season26%41% (11%)8.4% (0.90%)
2021 Nationals29%37% (11%)9.7% (1.0%)
2022 Regular Season26%39% (10%)9.1% (0.93%)
2022 Nationals24%35% (8.4%)16% (1.3%)

In the above I'm showing the same percentages from the paragraph, plus in parenthesis I'm showing the percentage of all team matches played as well.

This shows a pretty consistent trend of a quarter or a bit more of team matches ending in 2-2 ties, around 10% of all of them being tied on sets, and around 1% of all matches being tied on games and being decided by the court 1 winner.  But 2022 Nationals showed a bit of an uptick in those decided by the court 1 winner, but that is a pretty small sample size so may be due to that.

And for what it is worth, while 2023 is still young, so same percentages seem to be holding.

What do you think?  Are these percentages of matches that come down to tie-breakers significant enough that you think it warrants going back to a 5-court format?


Thursday, December 8, 2022

Analyzing 2022 USTA NTRP year-end ratings - How often do appeals stick? How many are inappropriate?

I just wrote about 2022 year-end ratings and how many players have already appealed their rating, but a natural follow up question is how many of these appeals are really appropriate?

Allowing appeals is seemingly done for a few reasons:

  • Players get bumped up but want to continue to play their their old team and friends
  • Players get bumped up and there is no flight at the higher level and appealing down allows them to play
  • Players are improving but just missed a bump up and want the validation of the higher rating by their name
  • A team at the higher level needs players but roster limits require a minimum number of at-level players so if someone appeals up, they help meet that minimum number

One can debate which of the above, or other reasons there might be, are legitimate reasons to appeal, but one could also make the case that if someone appeals and then goes back to their old rating after a year, perhaps that appeal wasn't appropriate or justified.

Whether you agree with the characterization of this scenario indicating an inappropriate or unjustified appeal, it is a statistic we can look at so I went above doing so.  What I'll be doing is looking at players that appealed in year X but in year X+1 went back to their old level.

I will note that my data is not necessarily 100% perfect, but I think it is good enough for us to get a good idea of what happens with players that appeal.

First, looking at players that appealed their year-end level up:

  • 2021 - 1,948 appeals up with 645, or 33%, bumped back down at 2022 year-end
  • 2019 - 2,443 / 729 / 30%
  • 2018 - 2,018 / 630 / 31%
  • 2017 - 1,765 / 552 / 31%
  • 2016 - 1,866 / 574 / 31%

This shows a pretty clear trend of around a third of appeal ups being "inappropriate".

What about appeal downs?  Here that is:

  • 2021 - 3,307 appeals down with 1,060, or 32%, bumped back up at 2022 year-end
  • 2019 - 4,706 / 1,544 / 33%
  • 2018 - 3,123 / 1,400 / 45%
  • 2017 - 2,151 / 834 / 39%
  • 2016 - 2,122 / 834 / 39%
Here we see a higher percentage, but not quite as consistent year to year, of appeal downs being "inappropriate".

What do you think?  Do these stats tell us anything about whether the appeal system is working as intended?  Is it a concern that 30-40% of appeal players go back to their pre-appeal level?

Monday, December 5, 2022

Analyzing 2022 USTA NTRP year-end ratings - Who appeals and in what direction?

Next up in our analysis of 2022 USTA NTRP year-end ratings, we take a look at appeals.

We aren't even a week post ratings release, and not everyone that is going to try to appeal has done so so these stats could change, but many that want to appeal will do it right away so I think it is still worthwhile to take a look now.

First, my analysis shows that 2,633 player have successfully appealed, 1,476 of them down and 1,157 up.  For comparison, for 2021, 4,107 appealed down and 2,335 appealed up.

Where it gets more interesting is when splitting it out by gender.  Of the 1,476 appeals down, 632 of them were women and 844 were men.  That is a similar ratio to 2021, perhaps a bit more heavy towards men.  But for appeals up, it switches and women do it more with 953 women and just 204 men.  Again, this is a similar ratio to 2021.

So more women appeal up than down, and a lot more men appeal down than up.

But part of this may have to do with the levels players are at.  It is generally the case that lower rated players are more likely to appeal up and higher rated ones are more likely to appeal down.

Here are the appeals down and up for women using the appealed from level.

  • 2.5 - 0 / 670
  • 3.0 - 191 / 753
  • 3.5 - 449 / 390
  • 4.0 - 622 / 52
  • 4.5 - 411 / 2
  • 5.0 - 165 / 0
  • 5.5 - 18 / 0
And the men.
  • 2.5 - 0 / 71
  • 3.0 - 46 / 188
  • 3.5 - 473 / 148
  • 4.0 - 835 / 54
  • 4.5 - 626 / 7
  • 5.0 - 254 / 0
  • 5.5 - 17 / 0

We see that a lot of 2.5 and 3.0 women appeal up, and interestingly more 3.5s appeal down to 3.0 than up to 4.0.  At 4.0 and above there are very few appeals up and the majority are down.

The men also have more appeals up at 2.5 and 3.0 and that swaps at 3.5 and by a much larger ratio than the women with 3x appealing down vs the women vs just 15% more for the women.

What do you think?

Analyzing 2022 USTA NTRP year-end ratings - Bump rates by level and gender

Continuing on with my analysis of 2022 USTA NTRP year-end ratings, I take a look at bumps rates by level, both overall and by gender.

Here are the overall bump rates by level.


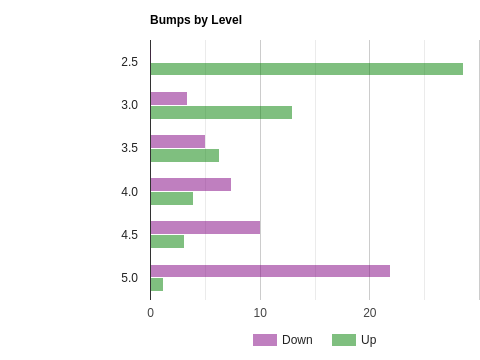
We can see 2.5s are only bumped up and not down, nearly 13% of 3.0s are bumped up vs under 4% being bumped down, 3.5s are close to even, and then at 4.0 and above there are more bump downs than up.

Let's see how it is by gender as well.  The women:


Not a whole lot different from the overall, just fewer bump ups once you get to 3.5 and above.

And here are the men:


As you'd expect, just a slight difference with more bump ups at most every level.

Stay tuned for more.

Sunday, December 4, 2022

Analyzing 2022 USTA NTRP year-end ratings - Section bump rates by gender

The USTA published 2022 year-end NTRP ratings last week so that means it is time to start doing some analysis to see what we can learn.

To start, we'll look at bump rates overall and by section including by gender.  In all the charts below, it is showing the percentage of players bumped down (purple) or up (green).

First, the overall rates were:

  • Stayed - 86.1%
  • Bumped up - 8.3%
  • Bumped down - 5.6%

This is very consistent with most years.  For the women:

  • Stayed - 85.7%
  • Bumped up - 8.7%
  • Bumped down - 5.6%
And then men:
  • Stayed - 86.9%
  • Bumped up - 7.6%
  • Bumped down - 5.5%
Not a lot of variation, the men are bumped up slightly less than the women, the bump down percentages are about the same.

Here are the overall bump rates by section.


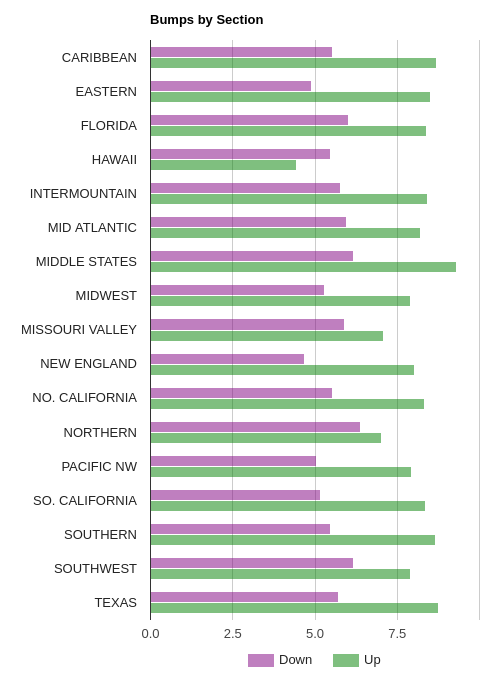
Unlike many years in the past where some sections have significantly higher bump up rates, we see that the bump rates are remarkably similar across the sections.  Just Hawaii, with slightly more bump downs than bump ups, and Northern, with just slightly more bump ups than down, don't fit the profile of most of the other sections where bump ups were about 50% higher than bump downs.

Taking a look at the same stats but by gender, here are the women.


Nothing is remarkably different here.  Just Hawaii and Northern are about equal bump up/down rates, and with a little variation the rest have about 50% more bumps up than down.

And the men.


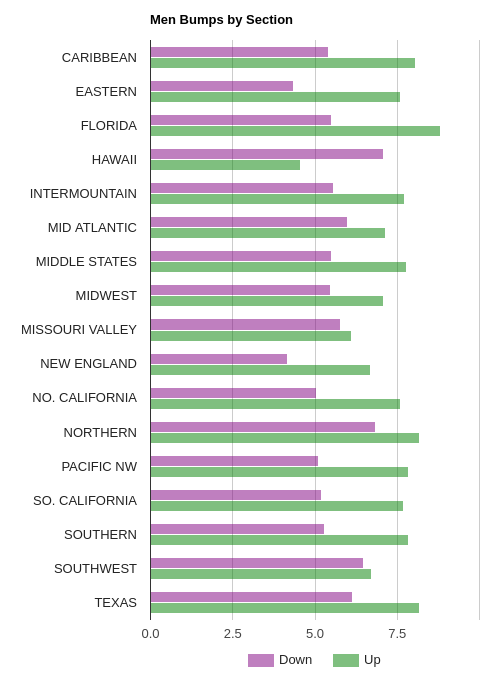
Here we see a few sections with more than 50% greater bumps up than down like Eastern and perhaps Florida.  Southwest is also close to near equal and Hawaii has a lot more bumps down than up and Missouri Valley is near equal.

Stay tuned for more.


Wednesday, November 30, 2022

2022 year-end NTRP ratings have been published!

It has been much anticipated, and has finally happened, the USTA has published year-end ratings for 2022!  As I write this, there are at least some players with 2022 year-end ratings on TennisLink.

To check what your rating is, you can go to TennisLink and look yourself up, or login and it should show your rating.  Make sure to check the date and that it is 12/31/2022 as that is what all new ratings should show.  If it still says a different date, yours may not be updated yet, or you didn't play enough matches to get a new rating.

Stay tuned for analysis of the ratings, but if anyone has any questions or wants to get a report to understand why they were/weren't bumped up or down, contact me!  And I'm always interested in situations where players successfully appeal, so if you do that and it is granted, drop me a note.

I'll be doing my usual analysis in the next few days, looking at general bump rates, then drilling in by gender and level and section (those links to 2019's analysis) to see what we can tell about how the USTA handled things this time around.  So stay tuned!

Tuesday, November 15, 2022

Week Seven of 2022 USTA League Nationals Recap

Week seven, the final week, of 2022 USTA League Nationals is complete, here is a recap.

This weekend was just 40 & Over Mixed with two levels played in Arizona and two in Orlando.  The Orlando even had a day washed out by hurricane Nicole but they went to a short set format on Saturday and got all the matches in, although I think a few teams didn't make it.

The 6.0 level in Orlando had the PNW team missing, but the other teams played with a five-way tie at 3-1 with Middle States, Eastern, MOValley, and Southwest advancing having the better court records.  Southwest and Eastern won the semis to make the final where Eastern won 3-0.

The 7.0 level was in Arizona and after Eastern and Hawaii went 4-0, there was a big tie with six teams at 3-1, but NorCal and SoCal stood out with the best court records and took the spots.  Eastern and NorCal played in the final where NorCal won 2-1.

The 8.0 level was also in Arizona and a nice and tidy four teams went 4-0.  Middle States beat PNW 2-1 while Intermountain did the same with SoCal, and then PNW won the final 2-1.

Last, the 9.0 level in Orlando had Southern and Eastern go 4-0, and then a three-way tie at 3-1 saw PNW and Florida advance with the better court records.  Eastern and Florida advanced with 2-1 wins before Florida won the final 2-1.

That is a wrap for 2022 Nationals!  Well, there are some what they call "Invitationals" to be played in the Spring with the 65 & Over and Tri-Level Invitationals, but at this point, the next big thing is ratings which should be published the week after Thanksgiving, I'm guessing on 11/30.

Congratulations to the new 2022 Nationals Champs!

Wednesday, November 9, 2022

40 & Over Mixed Nationals in Orlando in the path of hurricane Nicole

The last weekend of Nationals is this weekend with the 40 & Over Mixed events all being played, 7.0/8.0 in Arizona and 6.0/9.0 in Orlando.

Unfortunately, the latest on hurricane Nicole is that it is going to make landfall on the Atlantic side of Florida early Thursday morning and move inland and north pretty much right over Orlando.  The good news is it appears to be a quick moving storm so may be clearing out by Friday, but reports are that Orlando could get 2-4 or even 4-8 inches of rain, and the airport closed Wednesday afternoon.

The National Campus has already posted they were closed at 1pm Wednesday and will remain closed through 1pm Friday, but I don't know there is any guarantee they are ready to open and begin hosting a Nationals event right at that time.  If they are, perhaps they can still pull it off, perhaps with a short set format, but if they don't start Friday, would they try to fit it all in on Saturday and Sunday?

Of course, to have an event you need players, and most would have been arriving Wednesday and Thursday and it is sounding like no one will be arriving tomorrow so for anyone to be there and ready to play Friday had to have already arrived, or find a way to sneak in Friday morning.

In the grand scheme of things, this is just recreational tennis and pales in comparison to folks homes and belongings, and certainly lives that could be at risk from the hurricane.  But I will try to update this post or add others as I learn any more about plans for the weekend.

Update: It appears the plan is to use short sets and get all of the round-robin matches in on Saturday.  This will allow teams to make it there on Friday.  It isn't ideal, but is probably making the best of a tough situation.

The facility should be open Friday afternoon for check-in and courts available for practice with matches starting at 9am.  Most teams are expected to be there but perhaps some won't be able to make it.

Sunday, November 6, 2022

Week Six of 2022 USTA League Nationals Recap

Week six of this year's USTA League Nationals is complete and here is a recap.

This weekend was just 18 & Over Mixed with the 7.0 and 9.0 levels playing in Arizona.

The 6.0 level had three 4-0 teams advance, and then three 3-1 teams tied for the last spot with SoCal getting it with a better court record to join Intermountain, Florida, and Mid-Atlantic.  Intermountain won it all beating Mid-Atlantic in the final.

The 9.0 level had just two 4-0 teams in New England and Texas, the latter winning every match 2-1, and then four-way tie at 3-1 had NorCal and Southwest advance with the best court records.  Interestingly, both one-loss teams won the semis with NorCal beating Southwest in the final.

That is it for the 18 & Over Mixed, next weekend is the last and will have all of the 40 & Over Mixed levels playing, 7.0 and 8.0 in Arizona and the 6.0 and 9.0 in Orlando.

Saturday, November 5, 2022

USTA Adult League Participation 2013 thru 2022 - Participation is up! No, wait, it is down. Well, ...

I'm starting my year-end statistics and analysis a little earlier than normal this year.  I normally wait for year-end ratings, but some of the analysis isn't dependent on them, namely participation numbers.  Since my analysis uses the USTA rating year period and that just closed for 2022, I can do this analysis now.

I've done this analysis in past years, so I'm continuing the same methodology this year which is to look at unique players that played in the main Adult leagues, i.e. 18 & Over, 40 & Over, 55 & Over, and 65 & Over.

As I noted last year, trying to make sense of 2020/2021 is difficult due to how COVID disrupted league play.  I did generally treat 2020/2021 as one "year" in my analysis but did take a look at how things looked if they were treated as separate years as well.  I'll do some of the same below.

First, here is participation across all of the main Adult leagues treating 2020 and 2021 as separate years.


Participation is up over 10% over 2021!  Tennis is growing!  Well, yes, the stats show there was an increase over last year, but remember last year was still recovering from the COVID shortened 2020 that was down 23% from 2019.  This is why I had combined 2020/2021 for much of my analysis.

So how does it look with 2020/2021 combined as a single year?


Using this approach we see that participation grew in the combined 2020/2021, but has taken a healthy drop this year.  Treating 2020/2021 as one period for this analysis clearly has some flaws as one would not expect the growth in 2020/2021, if real, to have turned around into a significant decline this year.

But if 2020/2021 was representative, 2022 would have seen the largest drop in participation, both in raw numbers as well as percentage, since I've been doing this analysis.  There were about 23K fewer players participating which was a drop of nearly 9%.

Perhaps the best way to look at this is to ignore 2020/2021 and focus on the change since 2019 since that was the last non-COVID year.  2019 was pretty flat compared to 2018, but there had been a slow/steady decline since 2013.  From 276K to 258K the decline of 18K was 3K per year, or the decline of 6.5% over the six years was about 1.1% per year.  If that 1.1% had continued for three years, we'd be down another 3.3% or so, or down to about 250K.  The actual 2022 participation of 242K is down an additional 8K or 3.2%.

And just looking at 2022 compared to 2019, this year was down 16K or over 6%.

From this we could conclude that the decline we saw from 2013 thru 2019 has continued at an even higher rate, or participation has not fully recovered from COVID yet.  The truth is probably some combination of the two.

On the other hand, given 2019 was basically flat, you might make the case that the decline had stopped and participation was going to remain flat.  If that is the case, 2022 fell short of expectations by over 18K and over 6%.

Moving on to look at each age division on its own, here is the 18 & Over with 2020/2021 combined.


Here we see 2020/2021 didn't get the same bump the overall numbers did, and the drop this year was a pretty significant 9K or almost 6%.  Compared to 2019 the drop is slightly higher at almost 7% and also a greater rate of decline than previous years.

Here then is 40 & Over.


This division had shown significant growth in the fictitious combined year, but had a big drop for 2022.  It was 19K or 14% from 2020/2021, and the growth trend there was since 2013 to 2019 disappeared as 2022 was 9K or 8% down from 2019.

Last we look at 55 & Over.


This division had also been showing growth, particularly in 2019, but it had a modest decline in the combined 2020/2021 and 2022 was basically flat, both down just over 4% from 2019.

I think the message is pretty clear.  Overall, participation may still be affected by COVID, but even considering that, the decline we've seen over the past 10 years is likely continuing.

What is interesting is that the decline is not biased as much towards younger players as it was in past years.  Where 40/55 & Over leagues showed increases from 2018 to 2019 while 18 & Over declined, all declined similar amounts since 2019.

Note: These are statistics from the data I've gathered and may not exactly match the USTA's data or they may report numbers using different criteria than I am.

Friday, November 4, 2022

If the 2022 rating year is over, when will year-end NTRP ratings be published?

Based on what I've been told, the cut-off date for 2022 year-end ratings has passed and so now we await their publishing.  When will that be?

Historically the ratings are published "around December 1st", and that is what an e-mail I recently received said to expect, but the exact date varies a bit year to year, but is always sometime early/mid-week the week after Thanksgiving.

I've done a decent job of writing a blog post every year right around when the ratings come out, so here is the history so we can see if we can identify a trend.  In reverse chronological order and using PST since, well, that is where I am.

2021 - Tuesday 11/30 Around 9 pm

2019 - Sunday 12/1 around 9 pm

2018 - Wednesday 11/28 around 7 pm

2017 - Thursday 11/30 around 9 pm

2016 - Wednesday 11/30 around 7 pm

2015 - Sunday/Monday 11/29-11/30 overnight

2014 - Monday 12/1 around 9 pm

2013 - Sunday/Monday 12/1-12/2 overnight

2012 - Monday 11/26 early morning

There you have it, the date has always been by the end of day 12/1, but as early as 11/26.  In some years there was a published date or timer on TennisLink but sometimes that date was not hit and there were delays resulting in the dates above.

And the day of the week varies.  For awhile, it appears they were targeting Sunday night or Monday morning, but recently it has usually been mid-week.

If I were to hazard a guess, I would say to expect something around 9pm on either Wednesday 11/30 or Thursday 12/1.

Now we wait and see!

Tuesday, November 1, 2022

The 2022 Rating Year is Done!

The 2022 USTA League Nationals are not yet complete, there are still two weekends of Mixed Nationals to go, but Adult Nationals are now complete, and this year that means we are past the cut-off date and all matches that will count for year-end ratings have been played.

There has been some confusion the past couple weeks over what the date was.  I understood the date to be October 30, when the last Adult Nationals was completed, but most everyone I was hearing from was saying the were being told it would be November 13th, when the last Mixed Nationals would be finished.  I was pretty confident in 10/30 being the real cut-off but wasn't sure why the 11/13 date was being shared as the date.

This is by no means the final word, but I'd reached out to a coordinator and was initially told it was 11/13, but then was told that the cut-off date is indeed 10/30, but that there is a grace period to get matches entered and that date is 11/13.  Assuming this is the case, it is possible that 11/13 being the cut-off date for entry but the cut-off date for matches to be played was 10/30 was confusing and misunderstood and thus miscommunicated.

Also adding to the confusion is that last year the cut-off date was the last day of Mixed Nationals (11/14) and so one might logically conclude it would follow the same pattern this year.  However, to the best of my knowledge, all other recent years have followed the pattern of the last day of Adult Nationals and it appears last year was a one-time experiment with a later date, but we are back to the previous pattern.

So, I'm going with this past Sunday 10/30 as the cut-off date.  Apologies to anyone that I may have told 11/13 being the date, but I'm pretty sure I said I thought that might be wrong but what was being shared with a number of players.

Sunday, October 30, 2022

Week Five of 2022 USTA League Nationals Recap

Week five of 2022 USTA League Nationals is complete and here is a recap of who won.  See my recap of the round-robin for how the teams got to the semis.

The 55 & Over 6.0 women appears odd on TennisLink with New England advancing over Eastern in a semi, but no scores entered.  The other side had Southern beating Mid-Atlantic and Southern won the final.

The 55 & Over 6.0 men had Midwest beat Northern and Hawaii beat PNW to reach the final where Hawaii won the title.

The 55 & Over 9.0 women had Florida take out SoCal while Eastern beat Texas, and in the final Florida won it all.

The 55 & Over 9.0 men saw Middle States beat Southern and Northern beat Mid-Atlantic, and Northern won the final to take it all.

Moving on to 18 & Over Mixed, the 6.0 level Intermountain beat SoCal and Mid-Atlantic beat Florida and then Intermountain won the final.

The 8.0 level SoCal beat Mid-Atlantic and Caribbean beat Southern before SoCal beat Caribbean to win the final.

Last, the 10.0 level NorCal beat Texas and Southern beat SoCal, with NorCal winning the title.

Congratulations to all the teams!

The last two weekends of Nationals will be just Mixed with 18 & over finishing up next weekend in Arizona, and then 40 & Over Mixed playing the last weekend in Arizona and Orlando.