Wednesday, February 2, 2022

USTA Mid-Atlantic institutes a suspension points system for 2022

The USTA League program is for many a great way to play recreational tennis in a competitive atmosphere, giving players a conduit to compete with similarly skilled players in a game they love.

However, as with most things in life, league play isn't all a bed of roses.  Some players take things very seriously and get too competitive leading to sportsmanship issues and confrontations, there are chronic bad line callers, and players that self-rate too low and captains that encourage it, players that will throw games or matches to manage their rating, and the list goes on.  By and large, there are certainly more positives than negatives, but reducing the negatives should certainly be a goal of the USTA.

The National regulations outline a standard procedure for filing grievances for many of these situations, but there has not been a structure, that I'm aware of at least, for meting out punishment for various violations should they be determined to have occurred.  That is until now.

For 2022, the Mid-Atlantic section has published a "USTA League Suspension Point System" that outlines specific violations and the suspension points they will accrue, and the point totals at which specific suspensions will be levied.  Some examples:

  • Equipment abuse - 2 points
  • Unsportsmanlike conduct - 2-4 points
  • Tanking - 2-4 points
  • Threaten physical violence - 8-10 points
  • Gambling - 8 points
  • Self-rating lower than true ability - 2-5 points
  • Omitting information during self-rating - 8-10 points
  • Misrepresenting scores - 18 points
  • Misrepresenting identity - 24 points

There are more, but that gives you the idea.

Once a player accrues 10 suspension points in a 12 month period, they are suspending from league events for three months.  A second suspension occurs if another eight points are accrued (combined with those rolled over) in the next 12 month period, and another six points accrued or carried over results in a TBD suspension.

This is just a summary, there are other provisions outlined in the document, so give it a read if you are interested in all the details.

I do not know what precipitated creating this suspension point system, but suspect it was wanting to take some of the subjectivity out of handling complaints with repeat offenders.  Rather than simply giving consideration to past offenses, this structure lays out clear rules for how things should be handled.

If their goal was to scare players into behaving, perhaps that will work on the surface, but the challenge will always be what it has been in the past, how are any of these violations reported and proven?  Some are factual or can be fact checked, but others are still a subjective decision or he said/she said scenarios, so they will likely be hard to prove without video evidence or the like.  Perhaps this will lead to players recording their matches so they have evidence should something occur.

Additionally, I believe any violations have to be reported through the grievance system that requires the filer to pay a fee, so that alone will likely reduce a lot of the noise.  But I'm sure there will be some annoyed players that will file grievances because Sue habitually makes bad calls or because Bob is clearly tanking games, and it will be interesting to hear how things play out.

What do you think?  Is a suspension points system like this needed?  Or is it overkill?  Given it is in place, how do you think it will work?  Will grievances be upheld and players accrue points for suspensions?

Sunday, December 12, 2021

USTA Adult League Participation 2013 thru 2021 - Is the decline in unique players over?

Next for my year-end statistics and analysis is to look at participation numbers.  I've done this analysis in past years, so I'm continuing the same methodology this year which is to look at unique players that played in the main Adult leagues, i.e. 18 & Over, 40 & Over, 55 & Over, and 65 & Over.

This is clearly an odd year to be looking at participation with the USTA treating 2020/2021 as one rating period or "year", and 2020 being abbreviated due to COVID, and 2021 still affected as some players still stayed away to limit interaction with outsiders.

So should 2020/2021 be treated as one year?  Or should each year be looked at individually?  In general, I'm going to treat it as one year in this post, but I'll split out the years a little bit to see what we can learn.

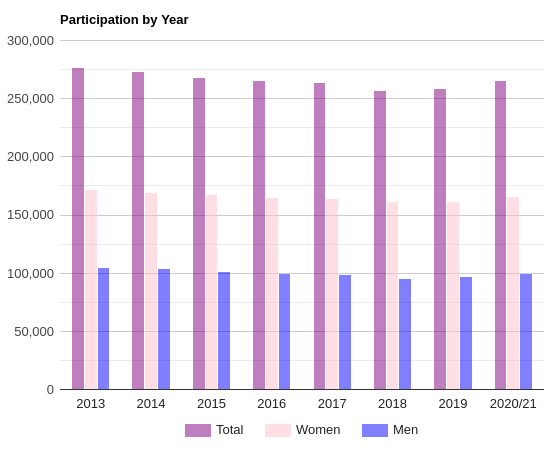
First, here is participation across all the divisions and treating 2020/2021 as one period.

Using this approach, participation in 2020/2021 is up over 2019!  In fact, it is back to 2016 levels!  Does this mean the steady decline in participation is over and there may be some growth?

I'm not sure that is a reasonable conclusion as combining any other two years would show significantly higher participation in that combined period, so combining 2020/2021 and see a slight bump should not be construed as real growth.

To illustrate that, here is what the chart looks like if each year is independent.

This more clearly shows what really happened, COVID wreaked havoc with participation in 2020, it is almost surprising it wasn't lower, and then 2021 has clearly recovered but is still well short of where things were in 2019.

It is obviously not fair to judge 2020 or 2021 as separate years against 2019, but combining them can be misleading too as it masks what is likely still a decline in participation.  I think I've shown the effect of COVID with the chart above though, so for the rest of this post I'll look at the different divisions using a combined 2020/2021.

Next, we look at unique players in 18 & Over.


This shows a slight decline from 195K to 193K, even with the combined 2020/2021.  So the same concern I've noted in past years remains, it appears either younger folks aren't joining USTA and playing league, or as existing players age they are choosing not to play 18 & Over.

Next, 40 & Over.


And here is where we see growth that makes up for the decline in 18 & Over.  The player population is aging and more are becoming eligible for 40 & Over it appears, and they do take that opportunity to play it.

Last, 55 & Over.

Interestingly there is a decline here even with the combined years.  Either there are just fewer players due to age, or those 55+ were more leery of coming back due to COVID concerns.

What do you think?  What does this tell us?  Anything?  Or due to COVID too many variables to make any conclusions?

Note: These are statistics from the data I've gathered and may not exactly match the USTA's data or they may report numbers using different criteria than I am.

Saturday, December 11, 2021

An early look at 2021 USTA NTRP year-end rating appeals - women appeal up and down, men appeal down

2021 year-end ratings have been published for 11 days now, and I've done some analysis already, but I thought I'd take a look at how many players have successfully appealed.

Note of course, there very well may be more players that appeal and have it granted in the future.  As hard as it may be to believe, not everyone lives and dies by their year-end rating and some players may not think about appealing until they start signing up for leagues in the new year.

But a lot of players do try their appeals right away, so at this point, I think we can get a good idea of the general trends.

First, at a high level, for players that received a 2021 year-end C rating, there have been 3,546 successful appeals 2,186, or 62% of them down and 1,360, or 38% up.  So more appeals down than up, but not quite a 2 to 1 ratio.

Next, breaking it out by gender, the women account for 2,166, or 61% of the appeals and 47% were down and 53% were up.  This is quite balanced and pretty close to 50/50.

For the men, they were just 39% of the appeals and a whopping 84% were down and just 16% up.  Clearly the men are biased towards appealing down.

But the level matters too, as it is more understandable that lower rated players may have a desire to appeal up while higher level players want to appeal down, sometimes just to have more playing opportunity.

For the women, here is how it breaks out for each year-end C rating and how many appealed either way:

  • 2.5 - 337 up
  • 3.0 - 66 down, 476 up
  • 3.5 - 206 down, 294 up
  • 4.0 - 342 down, 35 up
  • 4.5 - 281 down
  • 5.0 - 118 down
  • 5.5 - 11 down

We do see that as the year-end level goes up it swaps from players appealing up to appealing down.

For the men, here is how it breaks out:

  • 2.5 - 16 up
  • 3.0 - 12 down, 85 up
  • 3.5 - 197 down, 80 up
  • 4.0 - 433 down, 34 up
  • 4.5 - 377 down, 3 up
  • 5.0 - 138 down
  • 5.5 - 5 down

We see more appeals up at 3.0, but unlike the women the swap to more down happens at 3.5.  And the men have far fewer appealing at all at 2.5 and 3.0.

It appears men are more likely to appeal down than women are, but this is in large part because men tend to have more players appeal at the middle/higher levels than the women, and it is more likely that higher level players are going to appeal down than up.

What do you think?

Friday, December 3, 2021

Analyzing 2021 USTA NTRP year-end ratings - Bump rates by level and gender

With 2021 year-end ratings published, following on the bump rates by section, next up in the analysis is bump rates by level.

For all these charts, remember what is reported is percentages of players bumped up or down from the listed level, not raw numbers.  So there were not more total 5.5s bumped down than any other bump, rather the percentage of 5.5s bumped down was higher than any other percentage.

Here is the overall chart.


Probably not a big surprise, a lot of 2.5s bumped up, and more 3.0s and 3.5s bumped up than down, but at 4.0 and above, more players are bumped down than up.

Looking at just the women.


Similar trend, the scale of the chart is different because there are fewer 5.5s bumped down for the women.

And the men.


Again, very similar.

It will get more interesting to look at this by section which will come soon.

Wednesday, December 1, 2021

Are there irregularities with 2021 year-end Mixed ratings? Let me know if you've seen some

2021 USTA League year-end ratings are out, and I'm doing my analysis and writing down various observations, and it is too early for me to make any conclusions about what is going on with Mixed (M) year-end ratings, but something seems off.  I will continue to do my research and report back when I determine anything, but if you've seen something strange, players that should have gotten an M rating and didn't, or players that got a C rating that should have gotten an M, please drop me a note and let me know.

Analyzing 2021 USTA NTRP year-end ratings - Section bump rates by gender

2021 year-end ratings have been published, and my analysis continues.

I looked at some high level bump stats earlier, now we start to take a deeper dive, first looking at bump rates by section by gender.

Here are the overall bump stats by section.

Here we see remarkably consistent bump rates across all the sections.  Bump down rates range from 4.4% in PNW to 7.6% in Southern and bump up range from 8.6% in NorCal to 11.3% in Caribbean.  This is not nearly as large a range as in most years (here is 2019) and would seem to indicate the USTA didn't do much of any adjusting.

In fact, the sections that did well at Nationals weren't even hit that hard with bump ups which is surprising.  How on earth does Southern, that cleaned up at Nationals across genders and divisions, have among the fewest bump ups and most bump downs?  While PNW that did very little at Nationals has among the most bump ups and fewest bump downs?

Moving on to look at each gender.  Here is the same chart for the women.

Here we see Caribbean and Missouri Valley with the most bump ups, Hawaii and Northern having the fewest, and Southwest and Intermountain the most bump downs and several sections with less than 5% bump downs.

And here is the men's chart.

In what seems way out of whack, Southern and Texas had more men bumped down than up!  And Northern on the other hand led in bump up percentage which may be a first.

The Southern anomaly may be in part a reaction and adjustment to the Great Southern Bump of 2019, but that still is very strange considering how Southern did at Nationals.

While there are not radical changes, there do seem to be a few oddities for sure.  What do you think?


Tuesday, November 30, 2021

Analyzing 2021 USTA NTRP year-end ratings - An initial look at some high level stats

2021 year-end ratings are out, so now we can begin looking at some stats.

First, by my calculations over 251K players received a year-end rating, which is up slightly from 2019 when 245K did.  This is probably a good thing as any growth is good, but keep in mind 2021 included two years of play (albeit pandemic affected in 2020) so we aren't exactly comparing apples to apples.

Breaking this out by gender, women with year-end ratings rose from 150K in 2019 to 153K in 2021, and the men went from 94K to 98K.

Looking at bump rates, overall 6.5% of players were bumped down while 9.7% were bumped up.  This compares to 2019's 4.9% down and 10.5% up.

Breaking this out by gender, women had bump down/up rates of 6.1% and 10.6% which compares with 2019's 5.3% and 9.2%.  The men had 7.3% down and 7.9% up compared to 2019's 4.0% down and 12.9% up.

Stay tuned for more stats in the coming days.